User guide
Install
The plugin is not signed and not in the Grafana plugin catalog yet.
- Build it (
npm ci && npm run build) or download a release archive. - Copy the
dist/folder to the Grafana plugins folder asscelles-afmhost-panel/. -
Allow the unsigned plugin in
grafana.ini:[plugins] allow_loading_unsigned_plugins = scelles-afmhost-panel -
Restart Grafana. The visualization is listed as AFM host.
Grafana 12.3 or later is required; the plugin is tested with Grafana OSS 13.2.2.
To try it without installing anything in your own Grafana, run the
development server: just server (or docker compose up), then open
http://localhost:3000, dashboards AFM host demo and
anywidget-instruments-industrial gallery.
Choose a widget
In the panel editor, section Widget:
- Built-in widget (mode A): a widget bundled with the plugin, named
module:Class:examples:Counter,examples:Gauge,examples:Sparkline: the demonstration widgets ofexamples/;anywidget_instruments_industrial:*: the 52 widgets of anywidget-instruments-industrial (gauges, tanks, LEDs, switches, seven-segment displays, process objects, ...);anywidget_instruments_automotive:*: the widgets of anywidget-instruments-automotive (speedometer, tachometer, tell-tales, cluster, ...), for visualization only: no widget is meant to be operated while driving;anywidget_instruments_aeronautics:*: the flight instruments of anywidget-instruments-aeronautics (airspeed, attitude, altimeter, turn coordinator, heading, vertical speed): not certified avionics, not for navigation.
- Module URL (mode B): an AFM module loaded from a URL,
https:or on the Grafana origin, with an optional stylesheet URL. The Grafana administrator must allow it, see Remote modules.
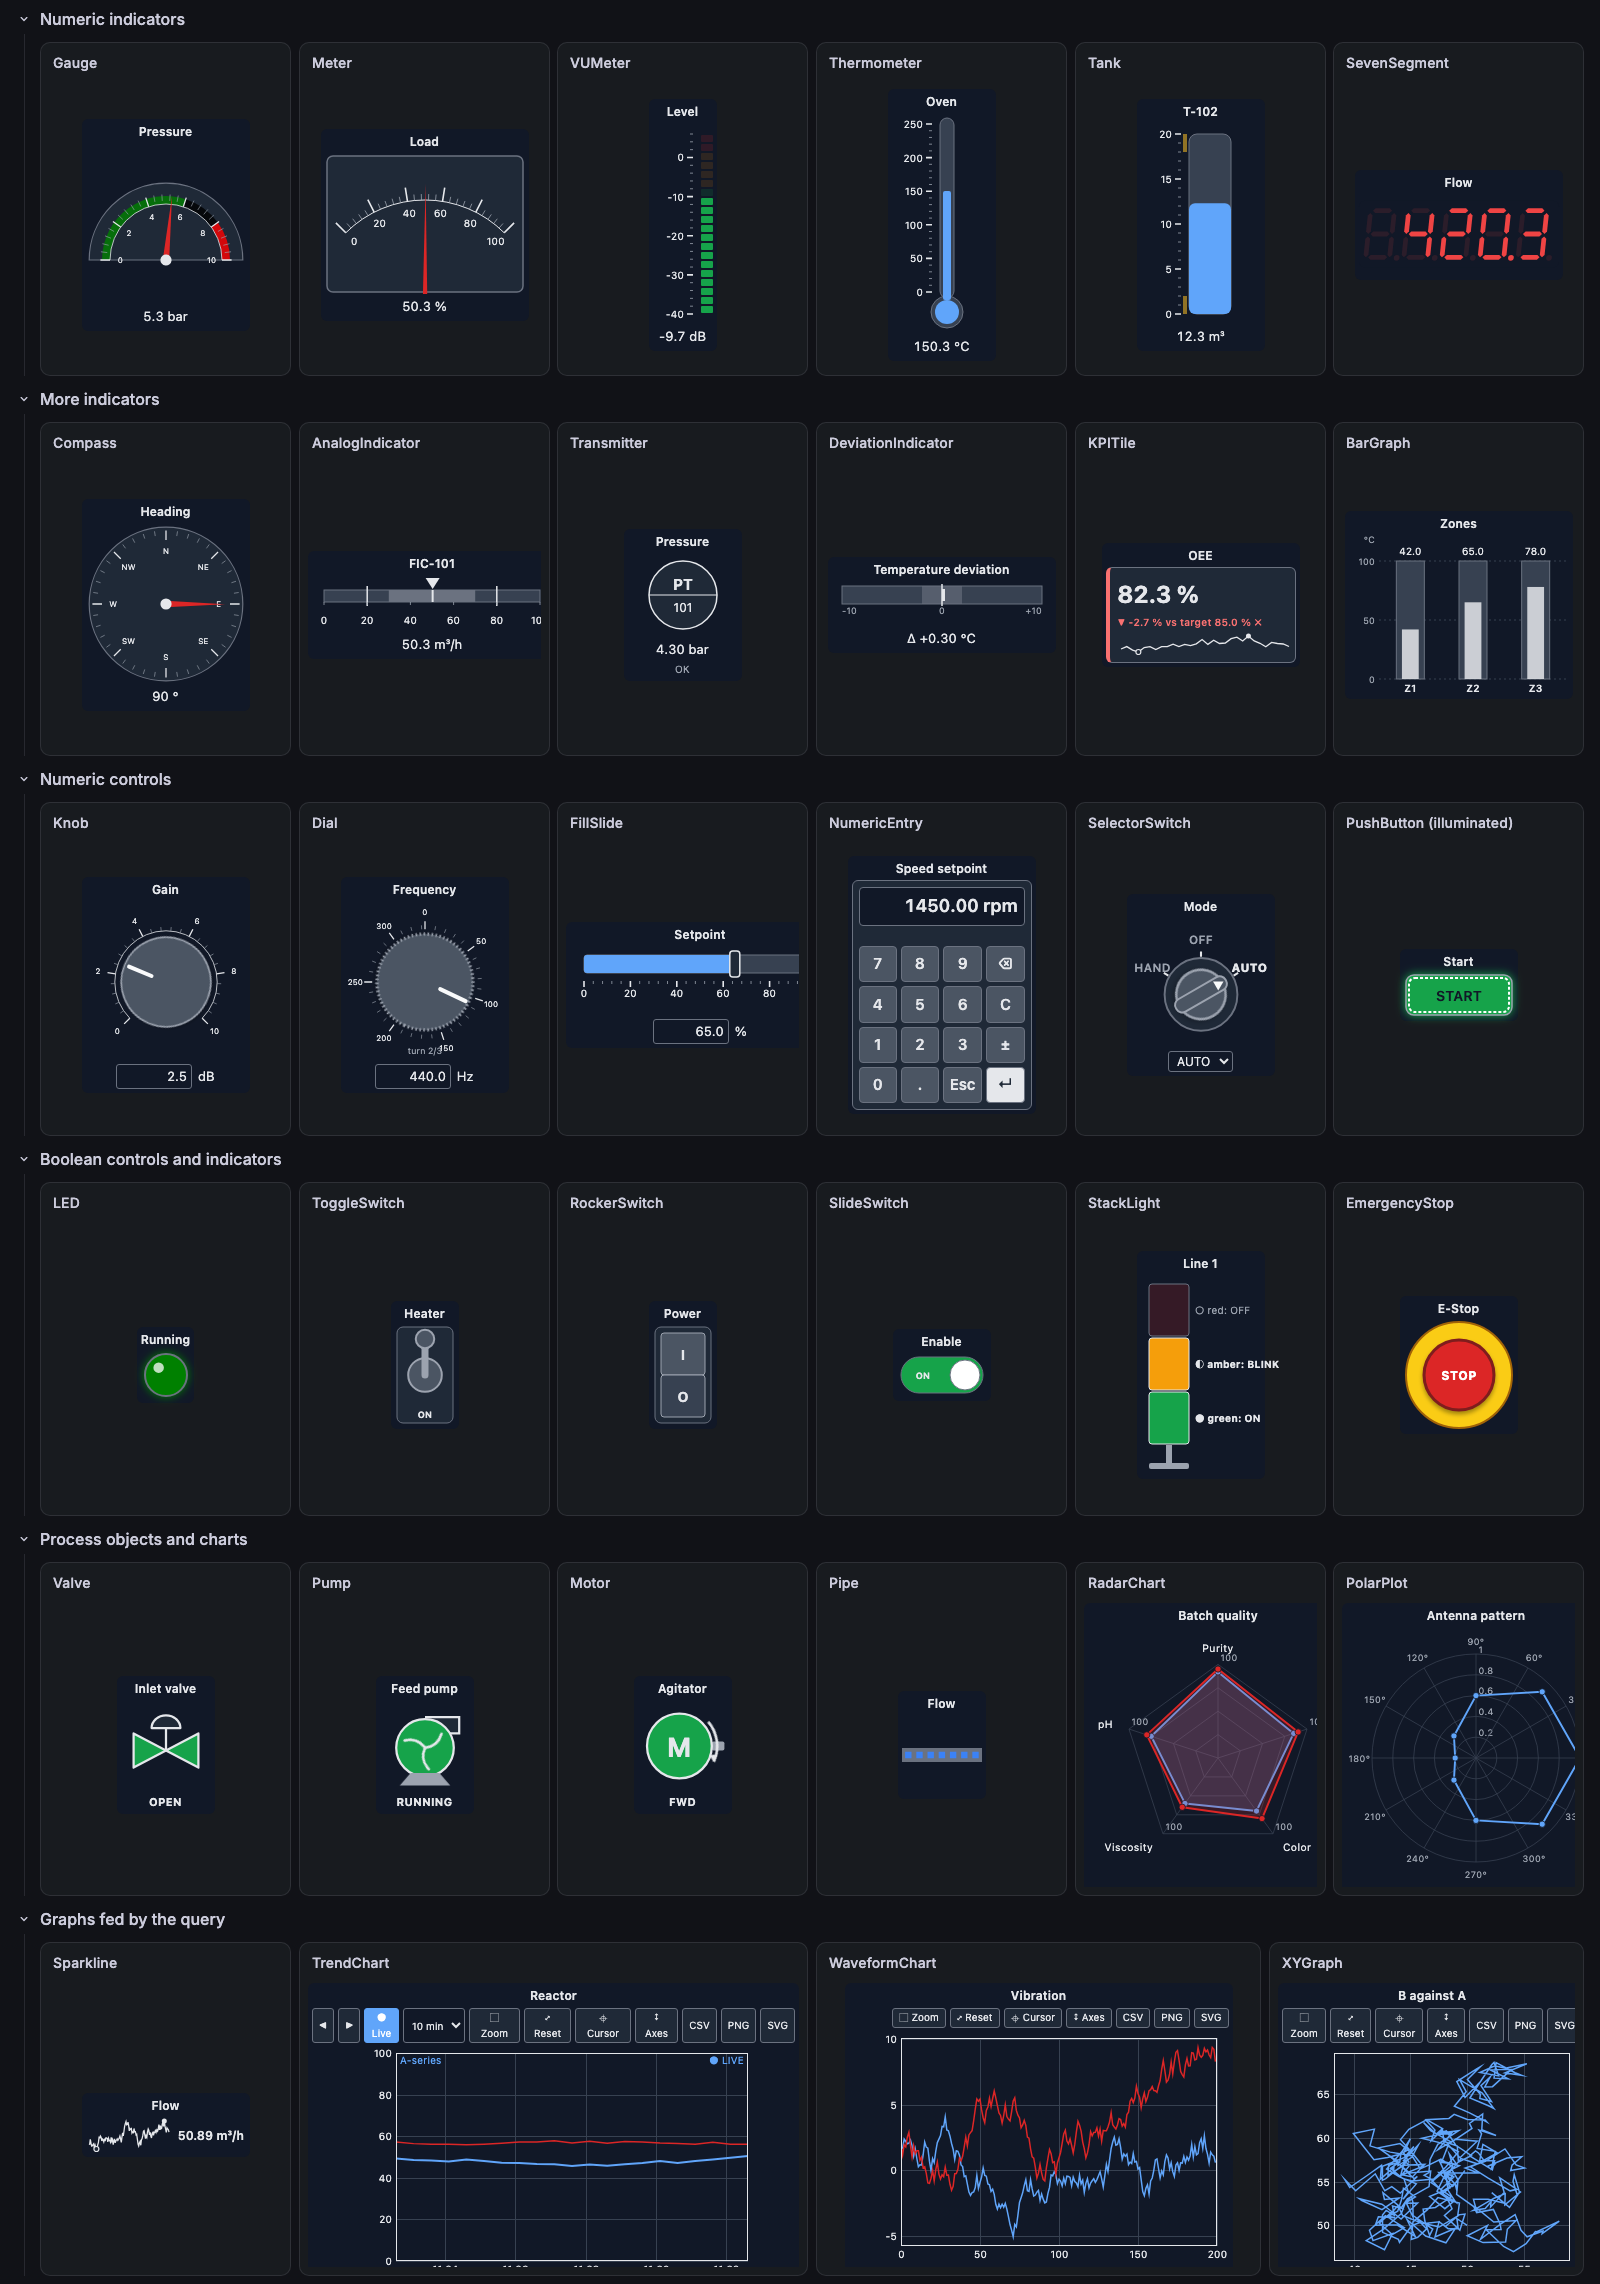
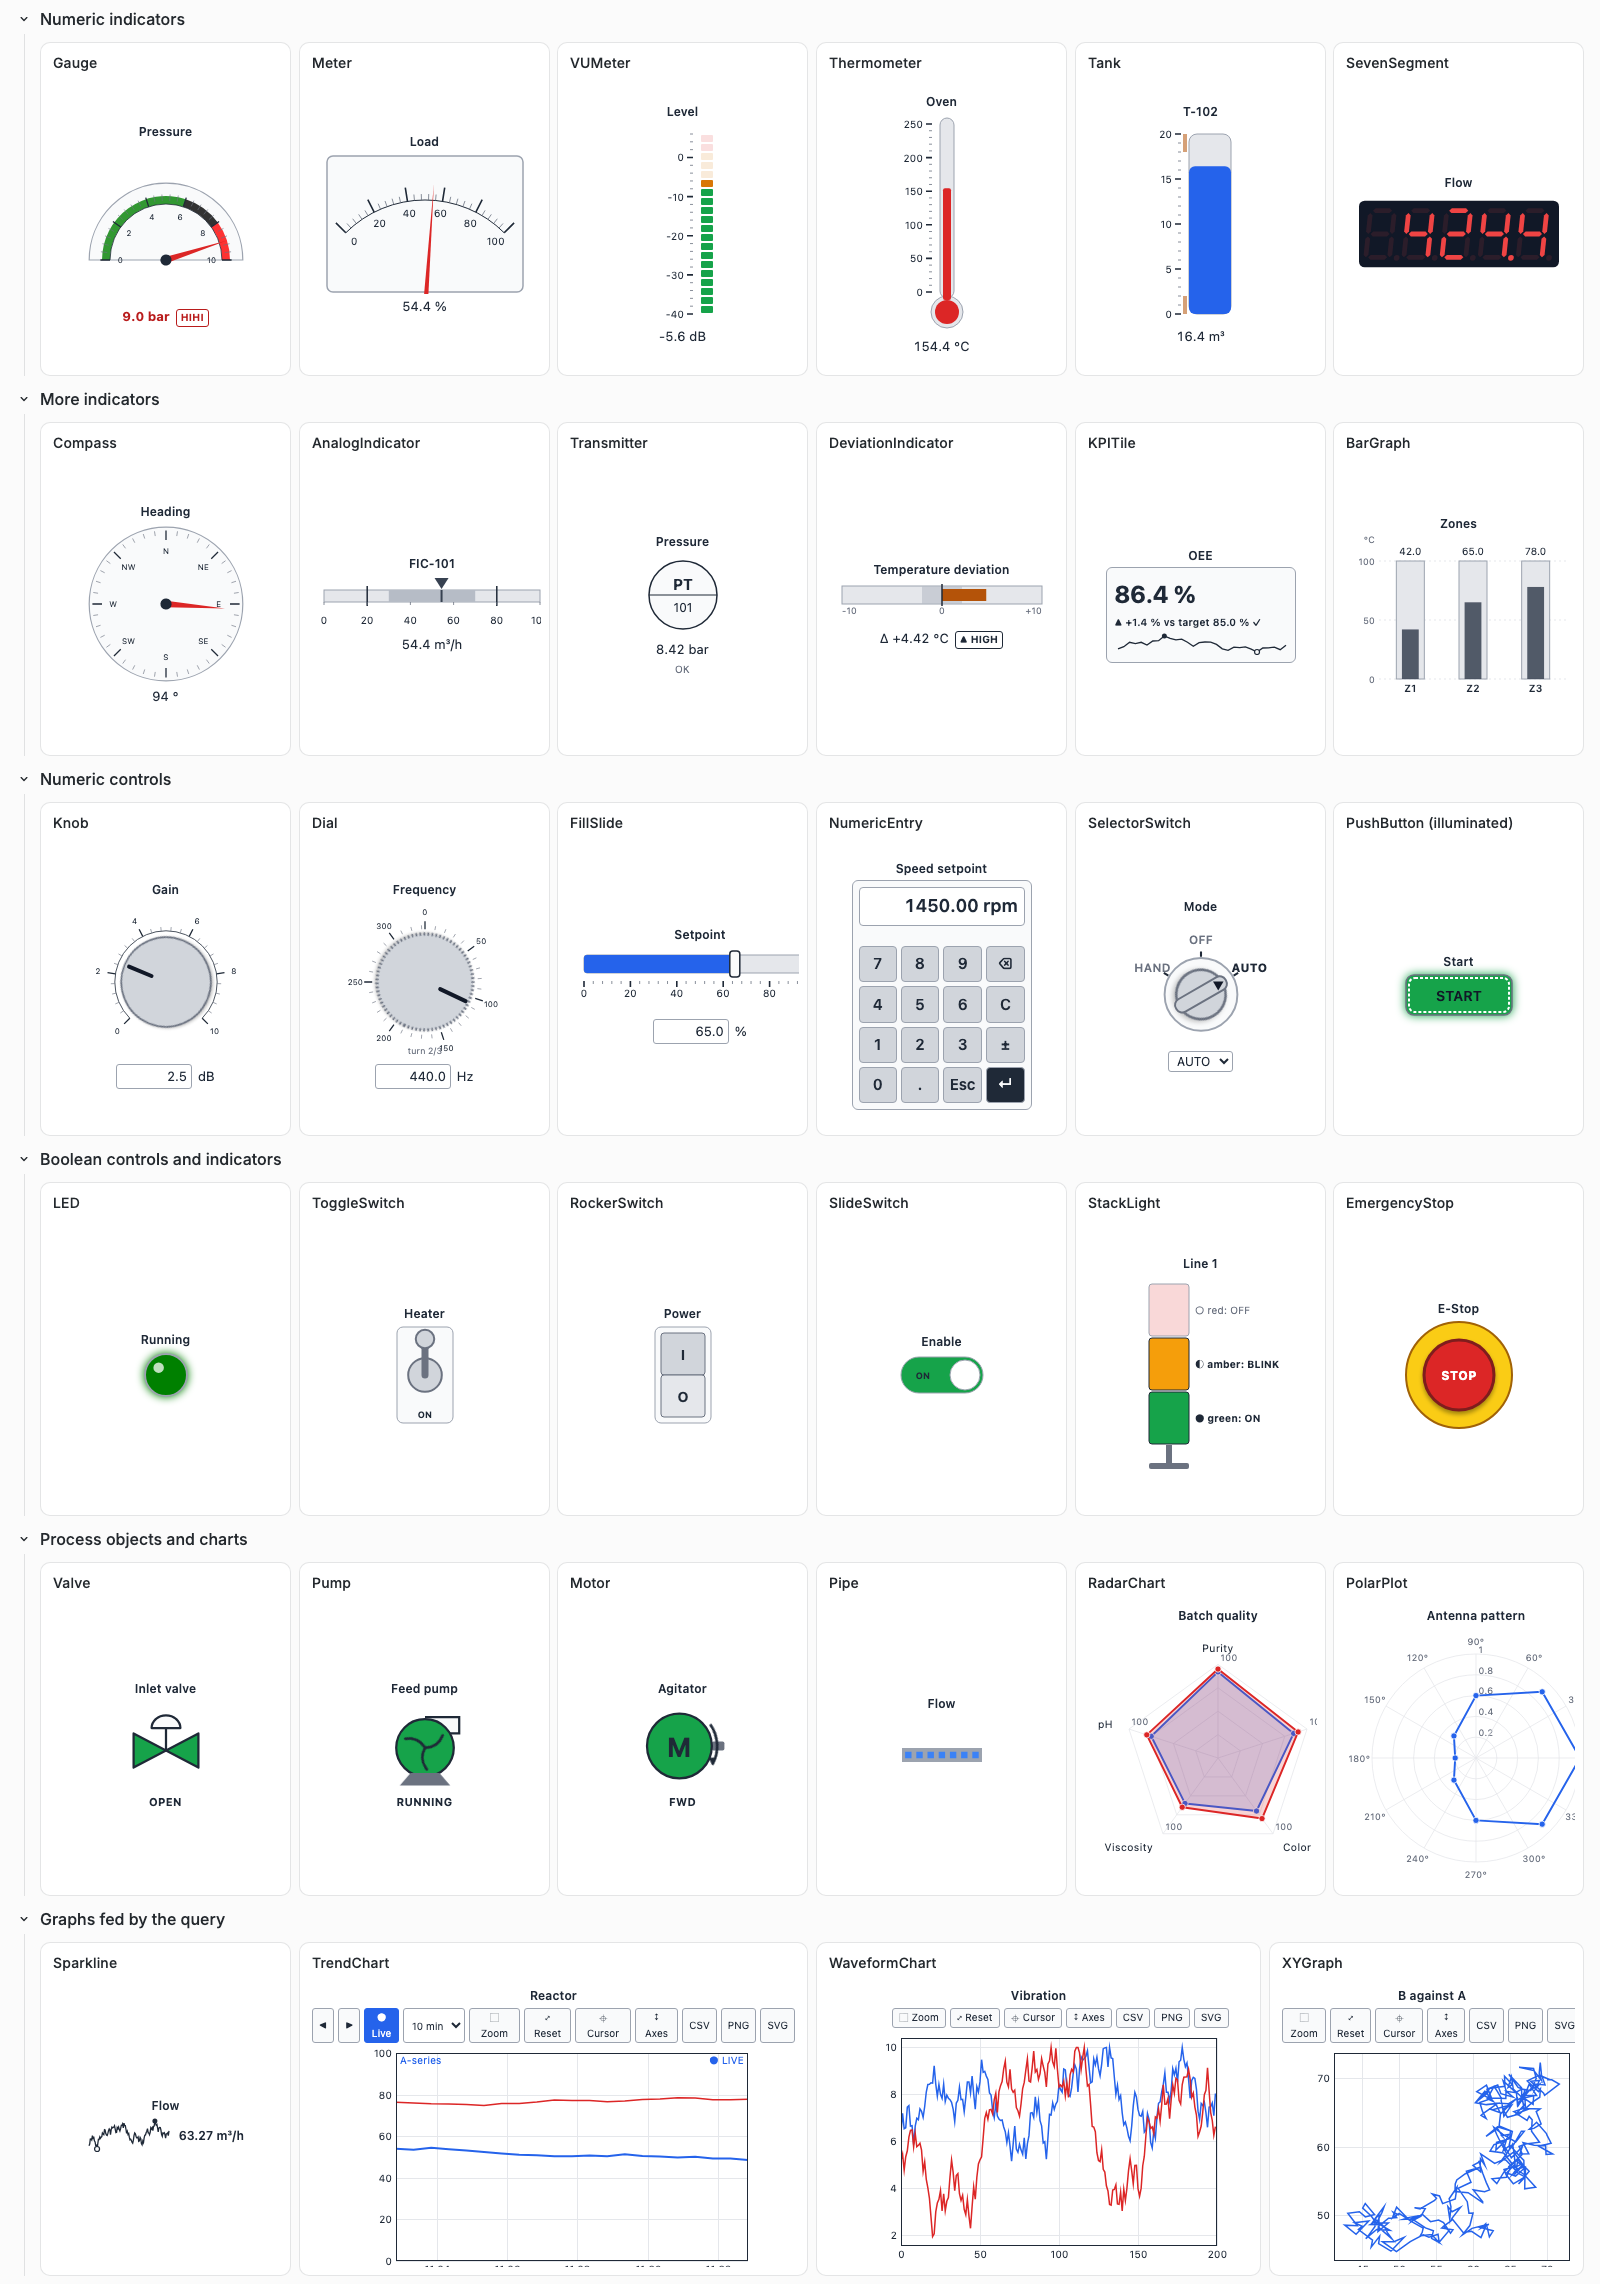
Built-in anywidget-instruments widgets: see anywidget-instruments for the traits of each family.
Bind traits to Grafana
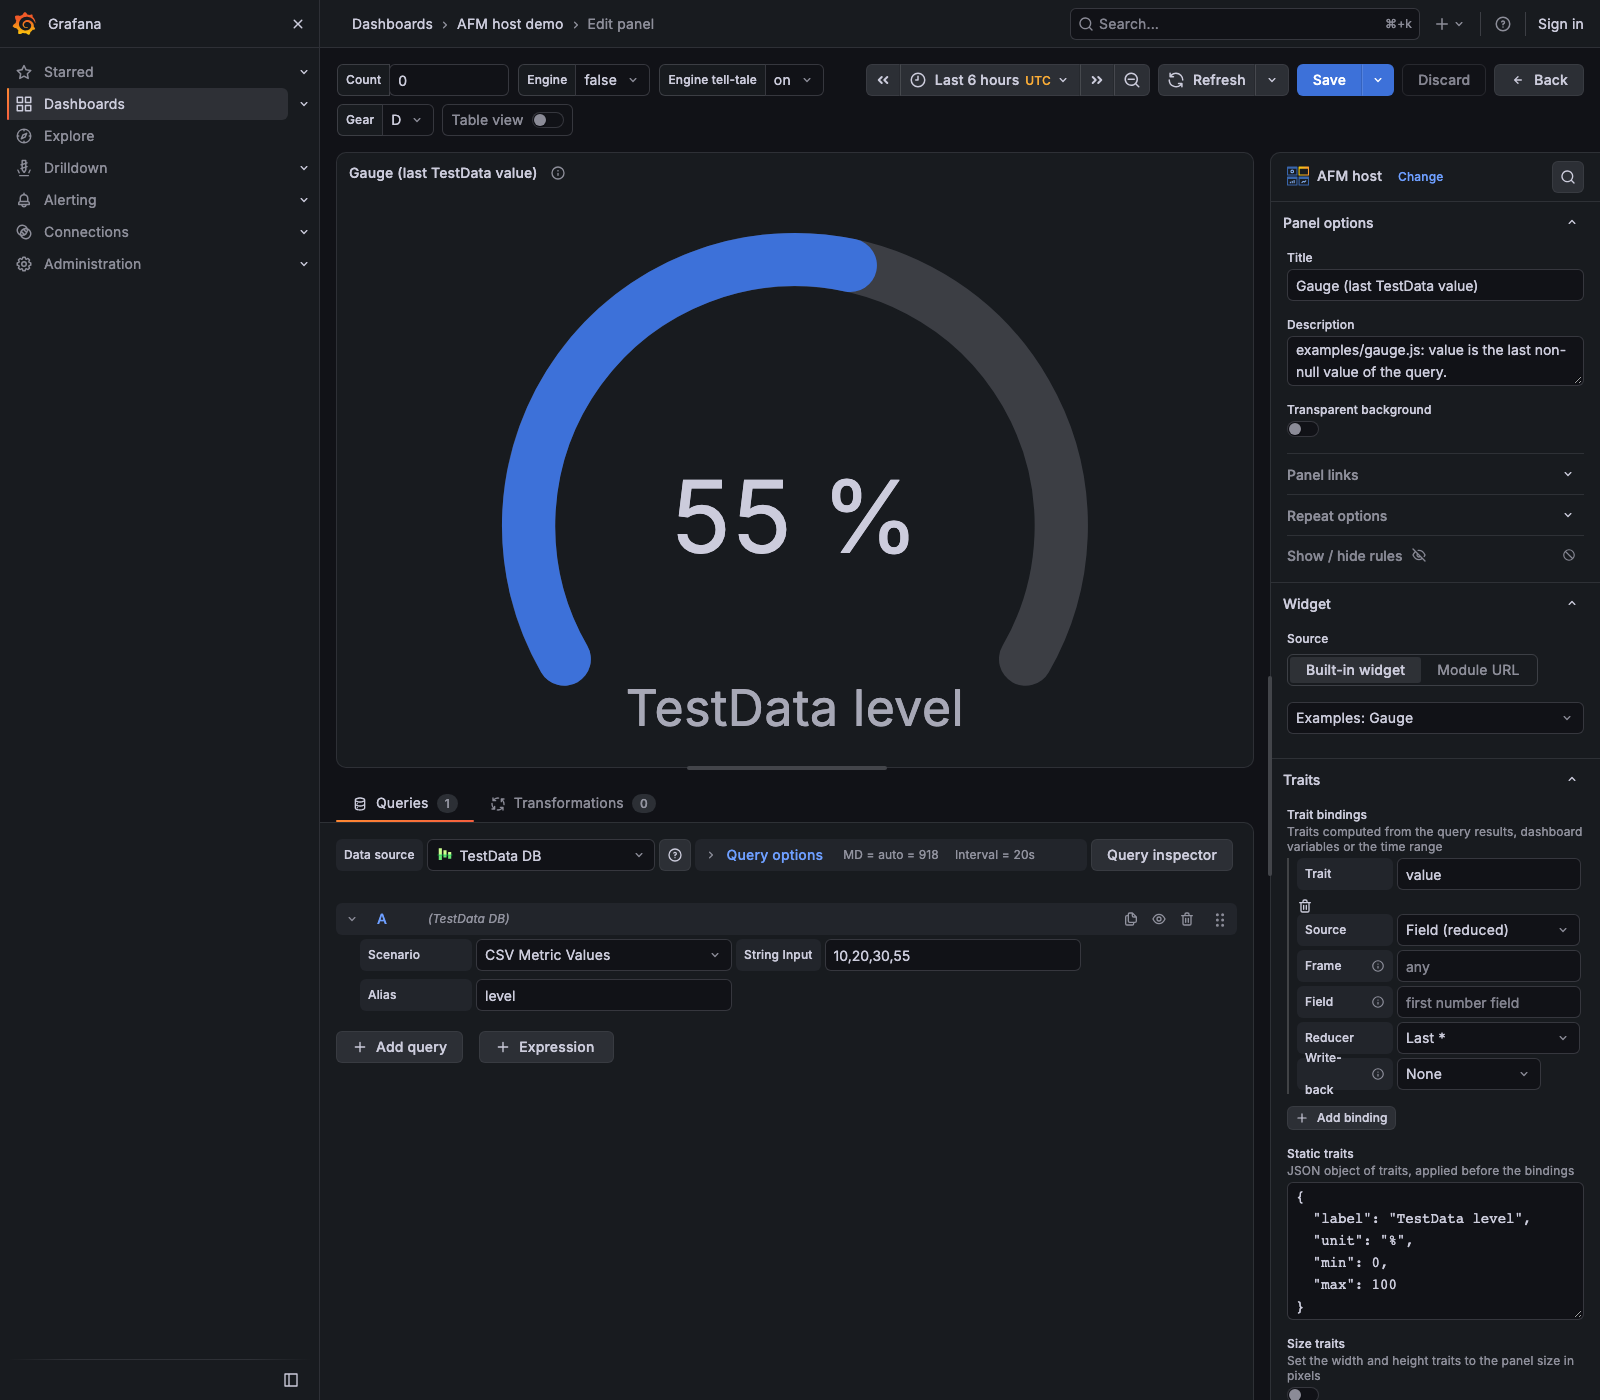
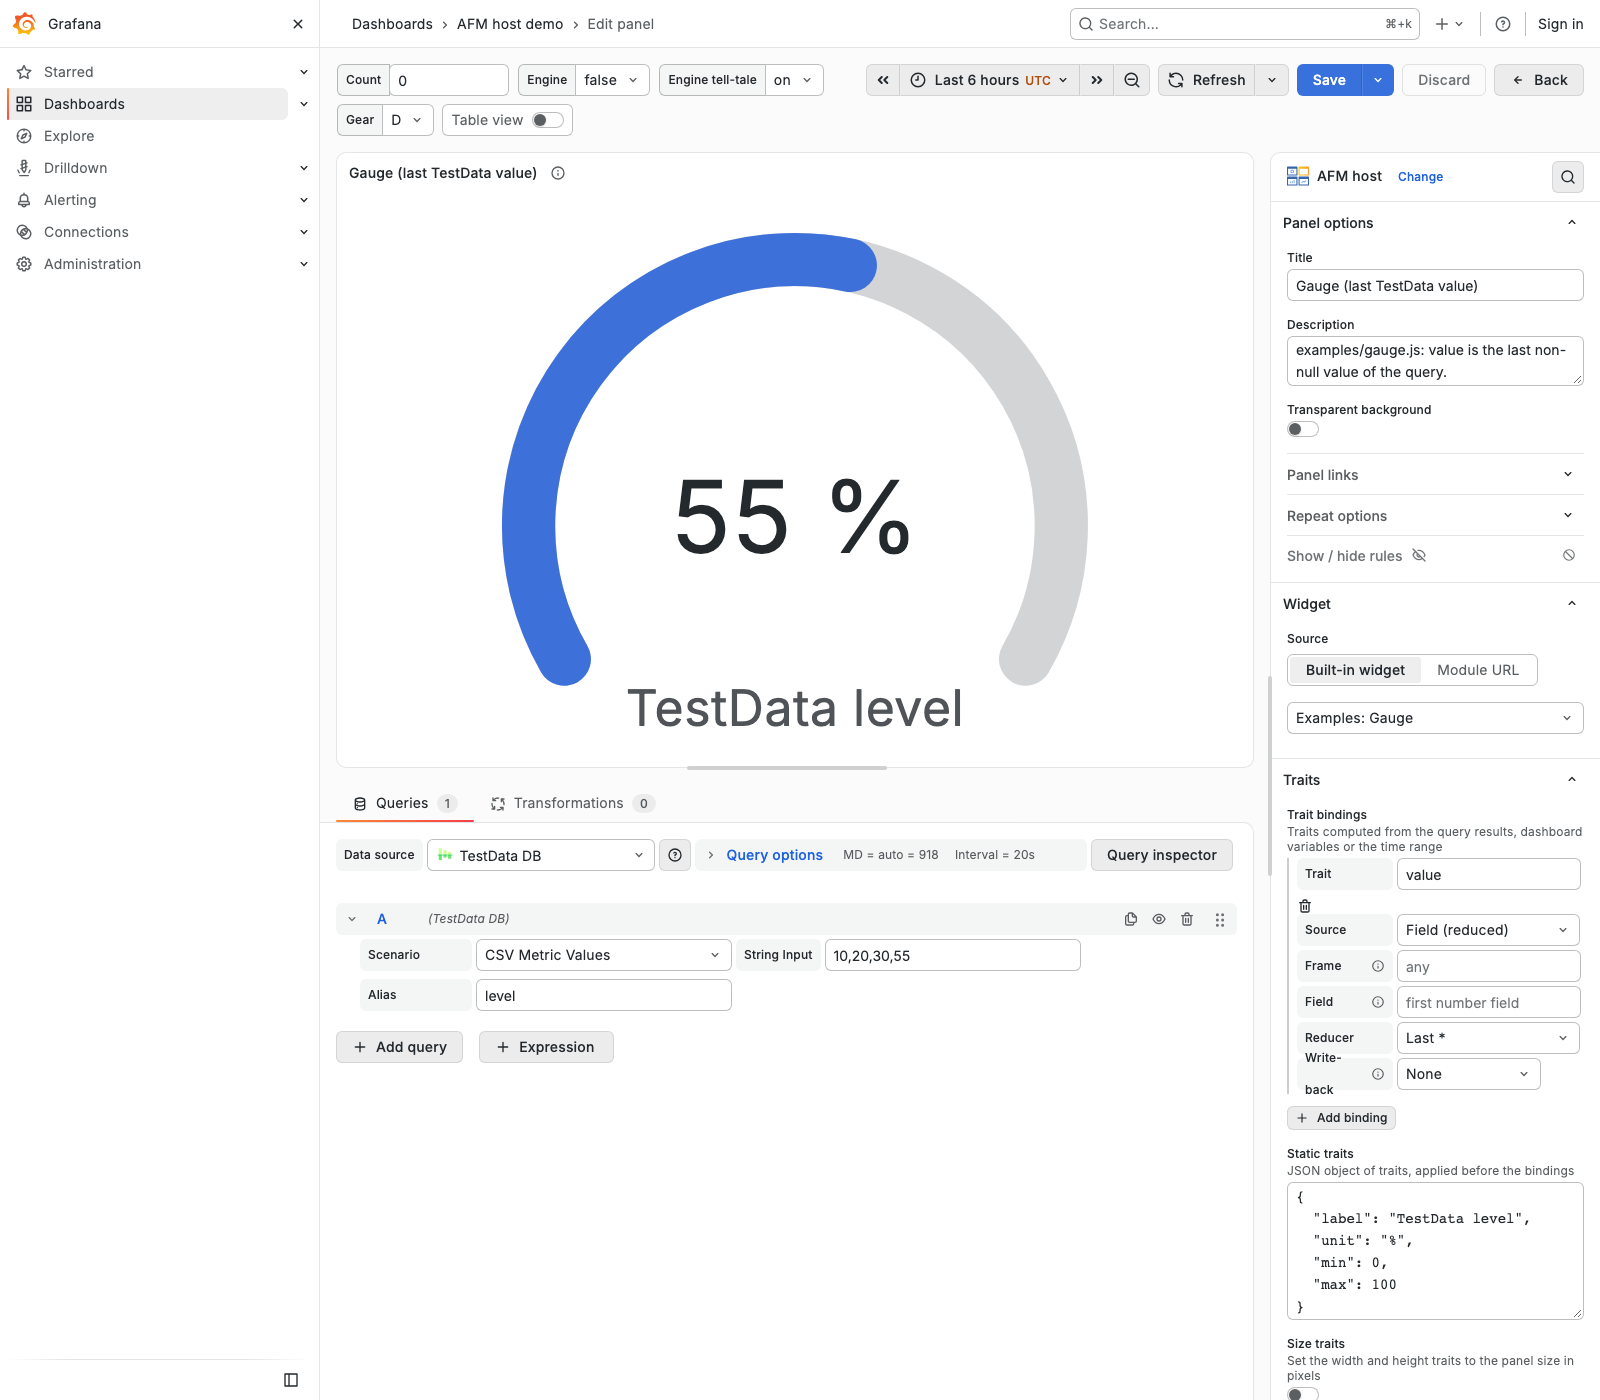
A widget reads traits (named values) from its model. In section Traits, the panel sets them in this order, a later one winning:
- the defaults of the built-in widget (for example
_kindfor the anywidget-instruments widgets); - Static traits, a JSON object such as
{"label": "Speed", "max": 200}; - Trait bindings, one row per trait;
widthandheight, when Size traits is on.
| Source | Value given to the trait |
|---|---|
| Field (reduced) | One value of a field, computed by a Grafana reducer (default: last non-null). Frame: refId or frame name, empty for any. Field: name or display name, empty for the first number field. |
| Field (all values) | Every value of the field, as an array; missing values are null. |
| Static value | A JSON value (other text is kept as a string). |
| Dashboard variable | The variable, read as text, number or JSON (${var:json}, for multi-value variables). |
| Time range | Start, end, or both ({from, to}), in milliseconds or ISO 8601 text. |
When a source has no value (field absent, frame empty, only nulls, variable not defined, text that is not a number), the trait keeps its previous value. Turn on Show diagnostics (section Display) to list these cases under the widget.
New query results update the traits of the running widget: it is not
rendered again, it receives change:<trait> events.
Write back
When a widget saves a trait (model.save_changes()), for example after a
click, the Write-back column of that trait's binding decides:
| Write-back | Effect |
|---|---|
| None (default) | Ignored, with one console warning per trait. |
| Variable | Sets the dashboard variable: the variable of the source, or the one named in to. Numbers and booleans are written as text, arrays and objects as JSON. |
| Panel options | Stores the value in the panel options (the static binding of the trait, or the static traits), saved with the dashboard. |
Example (the counter of the demo dashboard): a text box variable count, and
the binding value ← variable count as number, write-back Variable.
Each click sets count, which other panels can use.
Display
- Isolation: the widget is rendered in a shadow root (default), with its own CSS. Widget and Grafana styles do not mix. Choose None for a widget that looks for its own nodes in the whole document.
- The widget container carries
data-theme="light"or"dark"after the Grafana theme. The anywidget-instruments-industrial and anywidget-instruments-automotive widgets follow it (theme: "system", set by default); set"theme": "light"or"dark"in the static traits to fix it.
Remote modules
Mode B runs JavaScript from a URL in the Grafana page, with the rights of the viewer. It is off unless the server allows unsanitized panel HTML, the switch Grafana already uses for that trust level:
[panels]
disable_sanitize_html = true
or GF_PANELS_DISABLE_SANITIZE_HTML=true. With it, any dashboard editor can
run code in the browsers of the viewers: only turn it on where editors are
trusted. A Content Security Policy set by the administrator may also block
remote modules; built-in widgets are not affected. See Design.