anywidget-instruments-industrial
anywidget-instruments-industrial
provides instrumentation widgets for notebooks: gauges, meters, tanks,
thermometers, LEDs, switches, push buttons, emergency stop, charts, alarm
annunciators and SCADA objects. The plugin bundles its front end
unmodified, so the 52 widgets are available in Grafana without a URL or
network access, as built-in widgets named anywidget_instruments_industrial:<Class>.
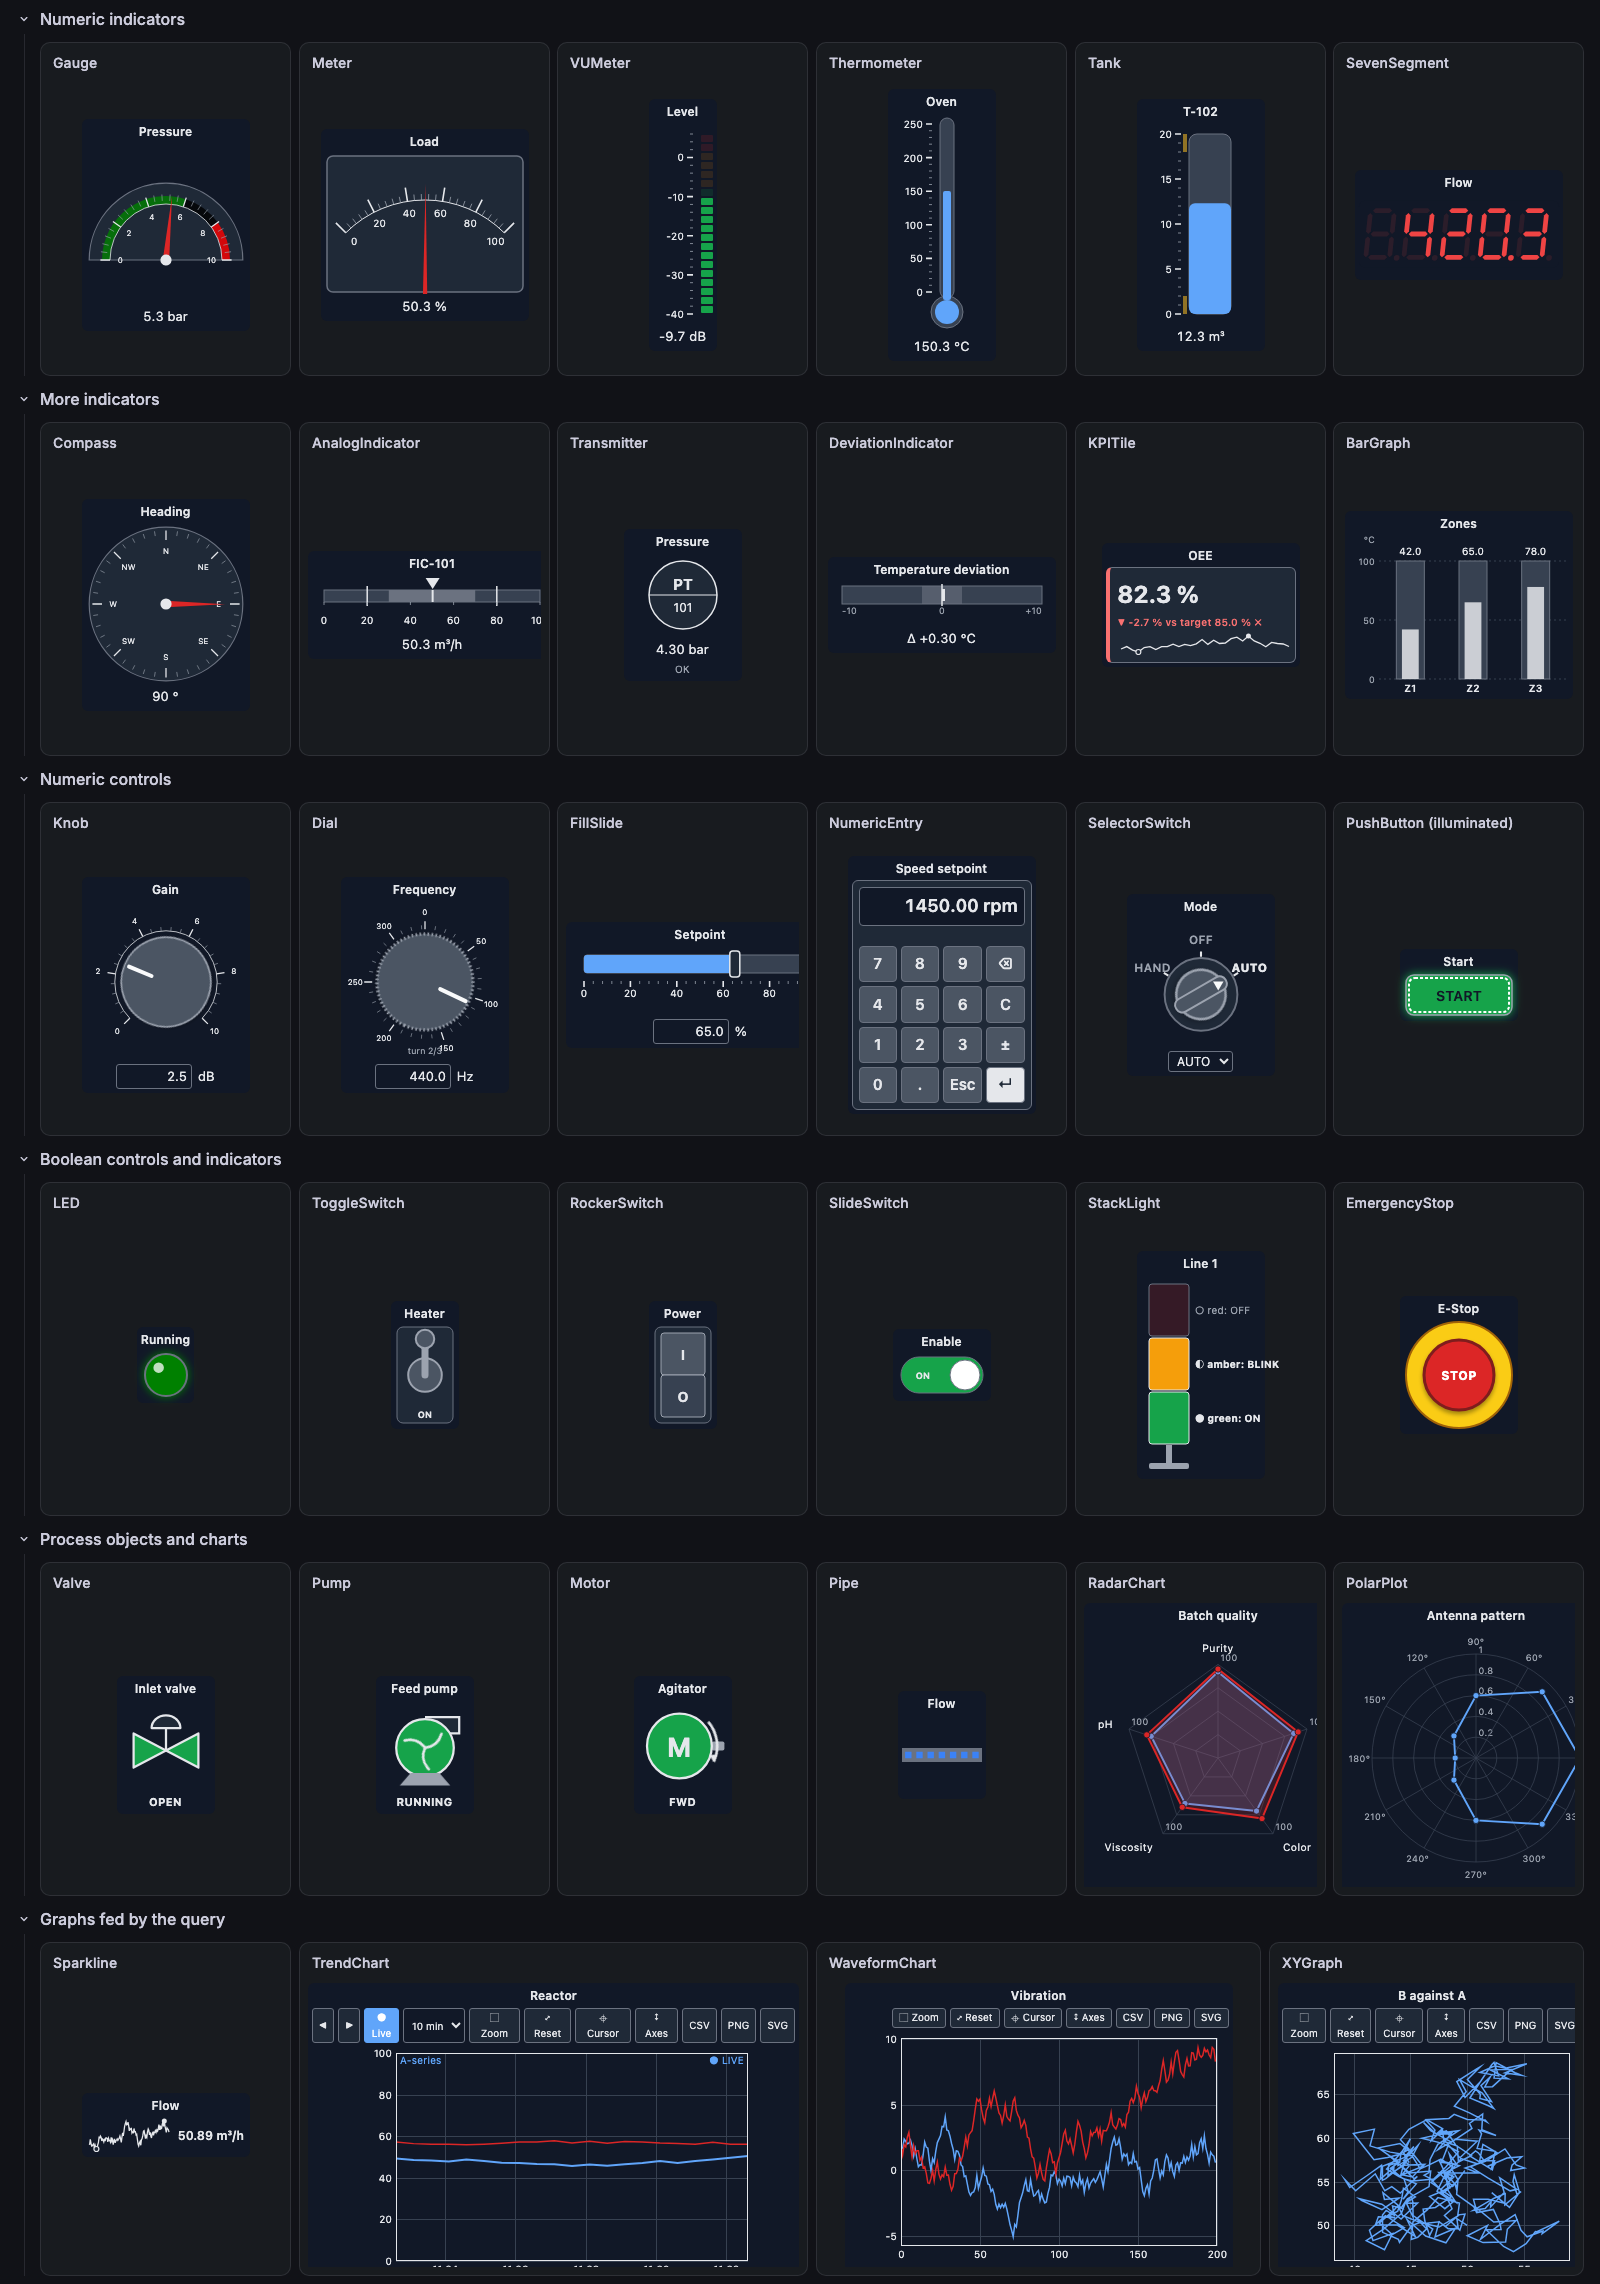
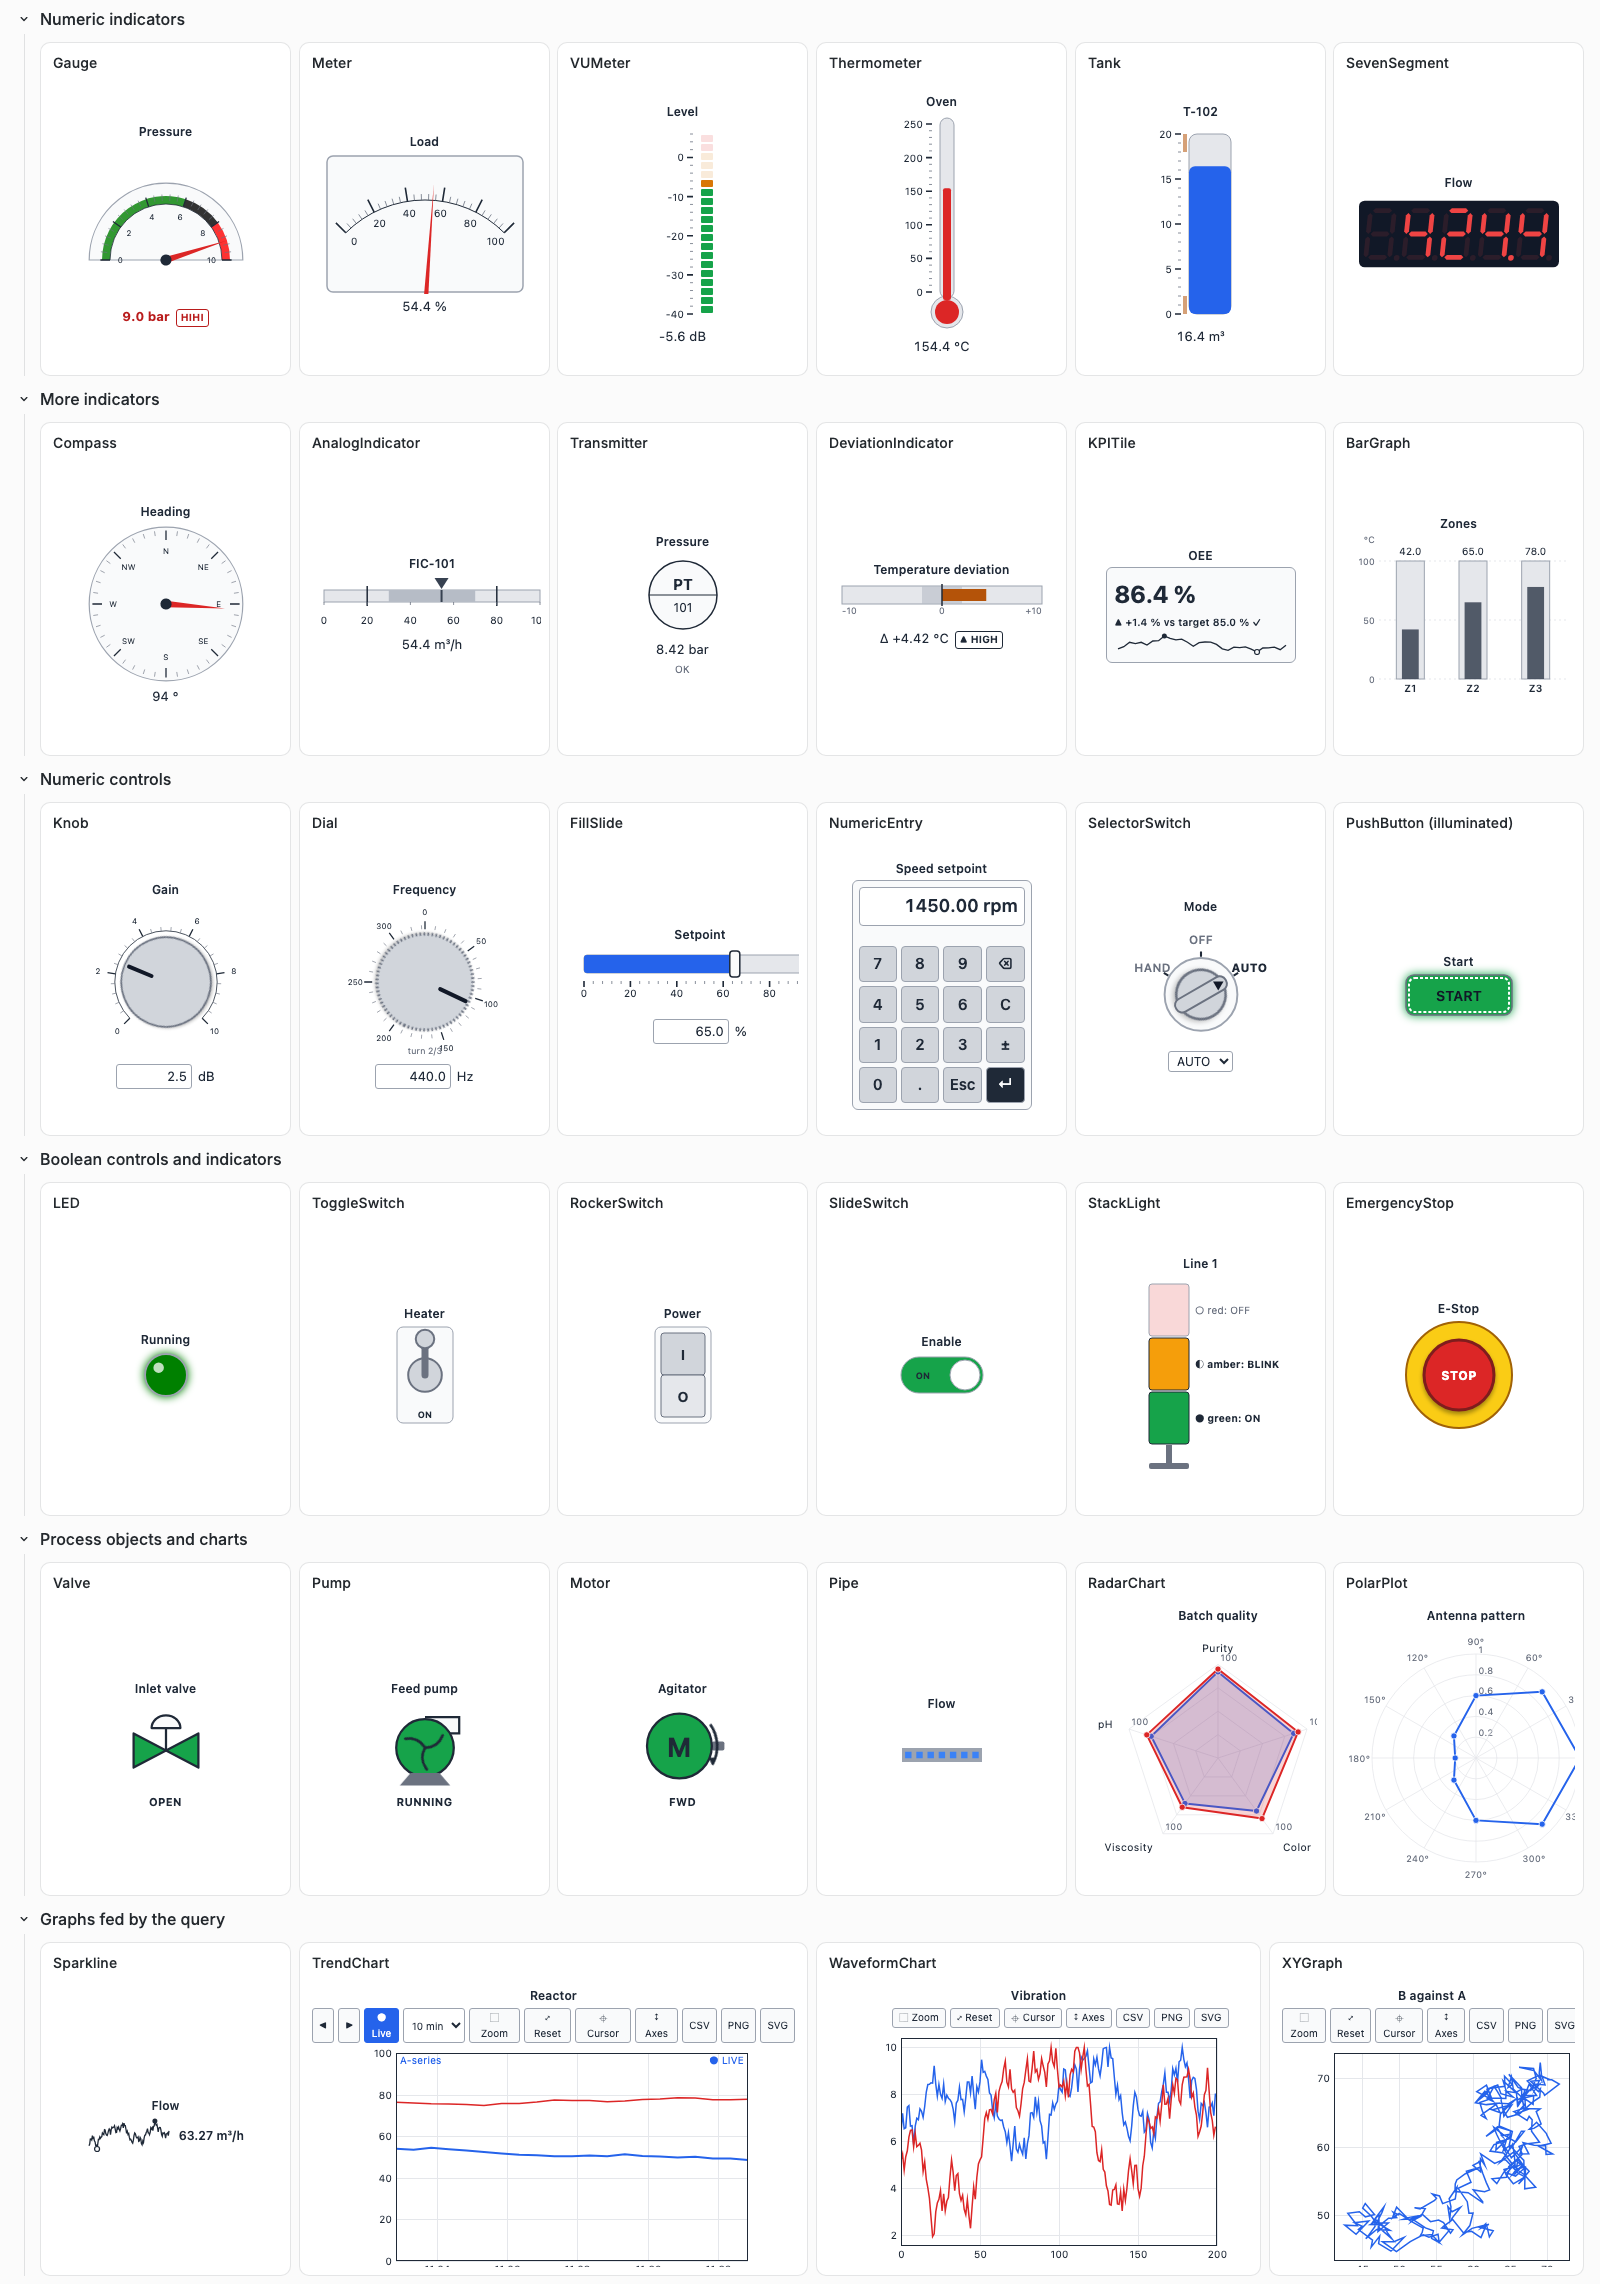
The anywidget-instruments-industrial gallery dashboard of the development server
(just server): 34 widgets, grouped as in the
widget catalog,
with the indicators fed by TestData. It follows the Grafana theme.
Use a widget in a panel
- In the panel editor, section Widget, choose Built-in widget, then
a widget of the anywidget-instruments-industrial group, for example
anywidget_instruments_industrial:Tank. -
In Static traits, set the traits of the widget, with the names and values of the widget catalog:
{"label": "T-101", "unit": "m", "max": 5, "lo": 0.5, "hi": 4.5, "show_limits": true} -
In Trait bindings, bind
valueto the query: source Field (reduced), reducer Last * (the default).
The panel sets _kind (which widget of the bundle to draw) and
theme: "system" (follow the Grafana theme) before the static traits; both
can be overridden.
Widgets by family
The families of the widget catalog, and what they need in Grafana:
| Family | Widgets | In Grafana |
|---|---|---|
| Numeric indicators | Gauge, Meter, VUMeter, Thermometer, Tank, SevenSegment, Compass, AnalogIndicator, Transmitter |
value bound to a field |
| Compact indicators | DeviationIndicator, KPITile, BarGraph |
value bound to a field (BarGraph: all the values of a field, or a static array) |
| Numeric controls | Knob, Dial, FillSlide, NumericEntry |
value written back to a variable |
| Discrete controls | ToggleSwitch, RockerSwitch, SlideSwitch, PushButton, SelectorSwitch, EmergencyStop |
value written back to a variable |
| Discrete indicators | LED, StackLight, BitField |
value bound to a variable or a field |
| Process objects | Valve, Pump, Motor, Pipe |
state ("open", "running", ...) from a variable or static traits |
| Specialized charts | RadarChart, PolarPlot, SmithChart |
data sets in value (static or JSON variable) |
| Alarms and events | AlarmIndicator, AlarmBanner, AlarmList, Annunciator, EventLog |
alarms in value (static or JSON variable) |
| Graphs fed by the query | Sparkline, KPITile, TrendChart, WaveformChart, XYGraph |
the query results, sent as messages by the panel (below) |
| Graphs fed by a kernel | IntensityChart, DigitalWaveformGraph, MixedSignalGraph |
draw nothing yet: they receive their data as messages from a kernel (limits) |
| Supervisory objects | PIDFaceplate, StateMachine, RecipeTable, EquipmentTree, SvgPanel, SynopticCanvas, PictureControl, ThemeSwitch |
static traits; the parts that expect a kernel stay idle |
Graphs fed by the query
These graphs do not read their data from traits: in a notebook, the kernel sends them their history as messages with binary buffers. In Grafana, the panel builds those messages from the query results, answers the graph when it asks for its data, and sends a new message every time the data change:
| Widget | Data sent | Set by the panel when you set none |
|---|---|---|
Sparkline, KPITile |
the last history values of the first number field |
|
TrendChart |
one pen per number field, its times from the time field | pens, named after the fields |
WaveformChart |
one trace per number field, the last history points |
n_traces |
XYGraph |
the first number field as x, one set per other field (the time as x when there is one field) | series, named after the fields |
Pens and series set in the static traits are matched to the fields by name, then by order. The Graphs fed by the query row of the gallery dashboard shows the four of them fed by TestData.
For plain Grafana time series, the Grafana visualizations remain the better choice.
Write back to a dashboard variable
A control saves its value when the operator acts on it. With the
Write-back column of the binding set to Variable, the value goes to a
dashboard variable that other panels read. On the demonstration dashboard,
ToggleSwitch writes the engine variable, which an LED reads:
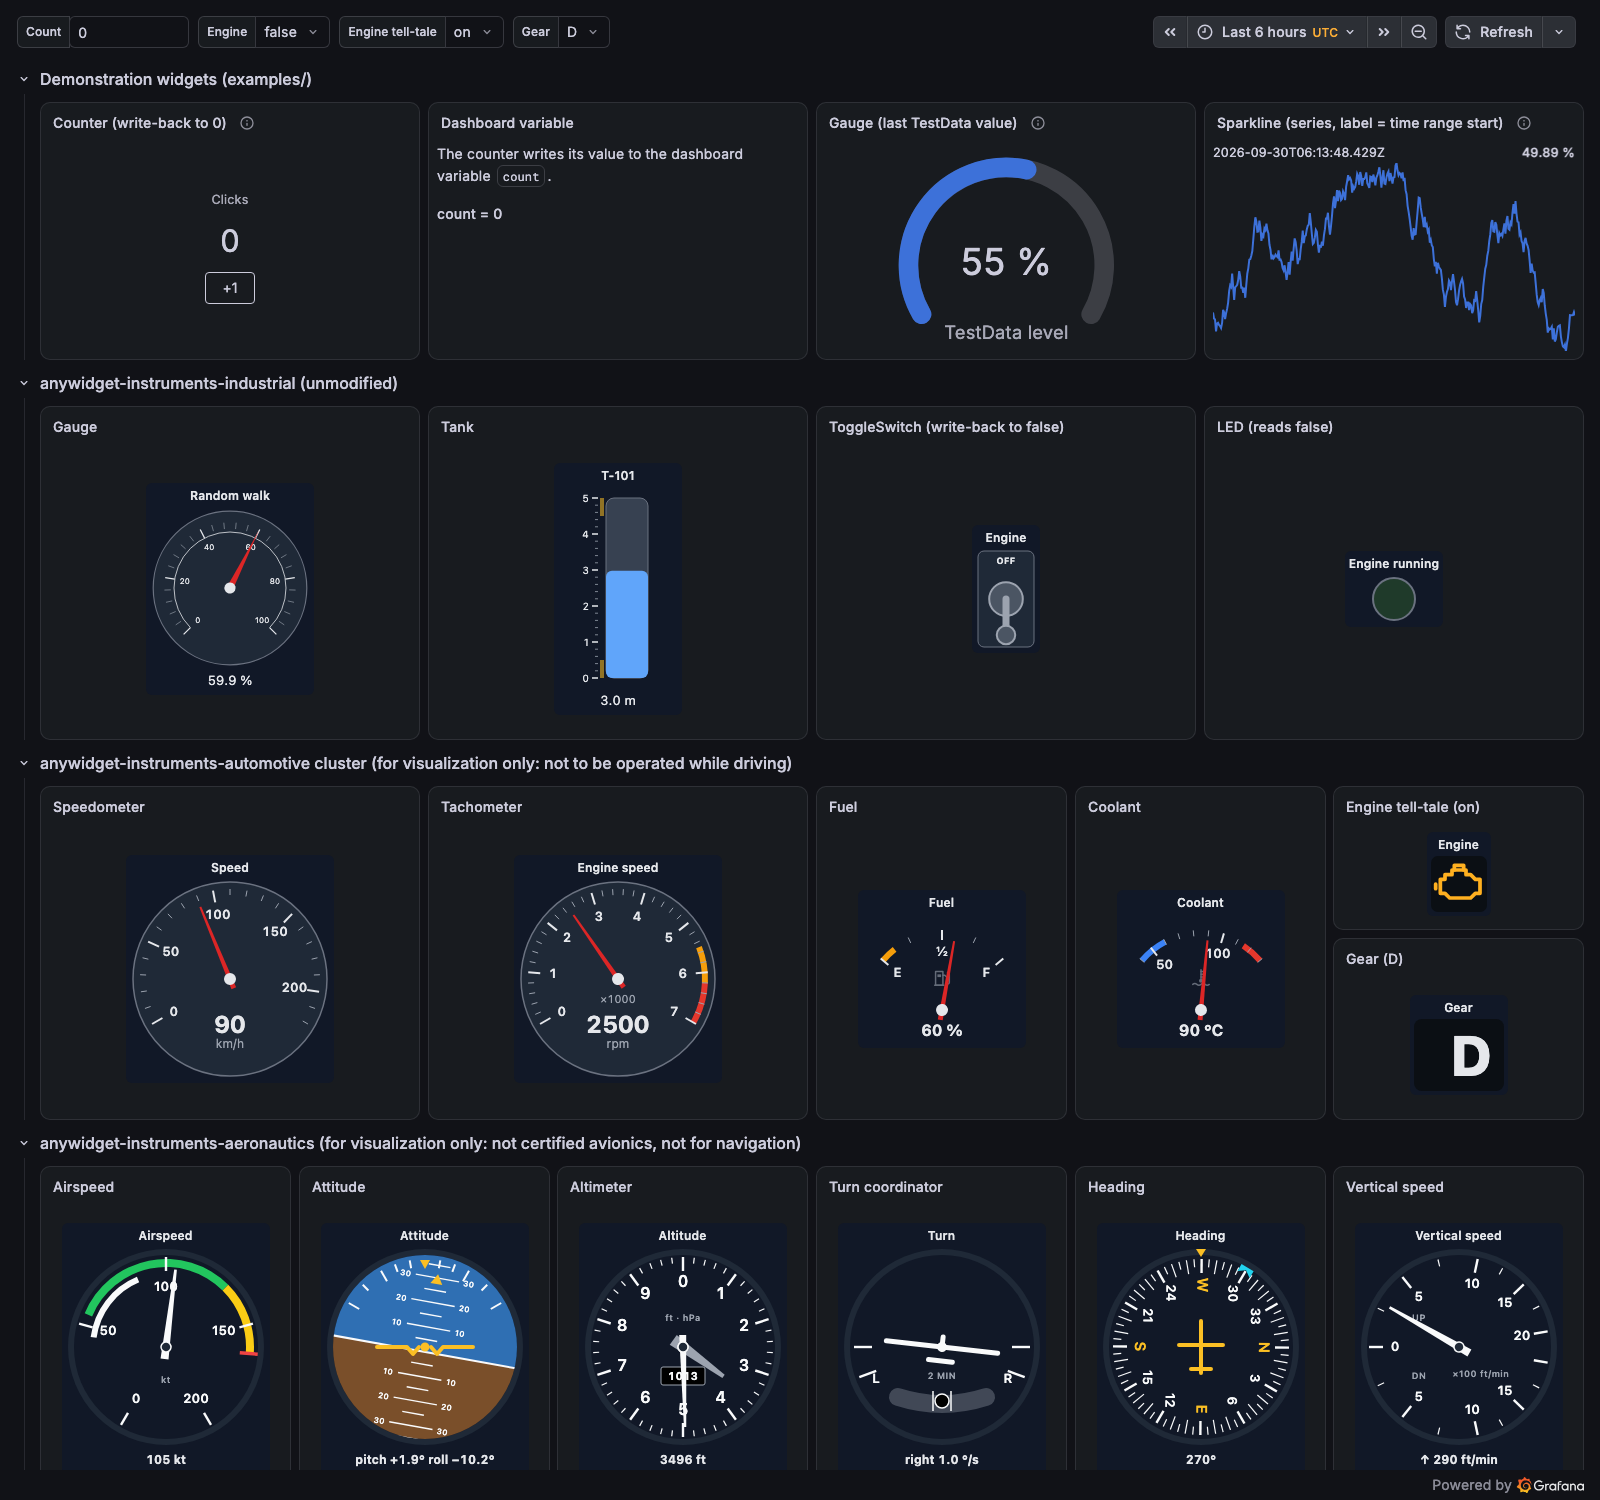
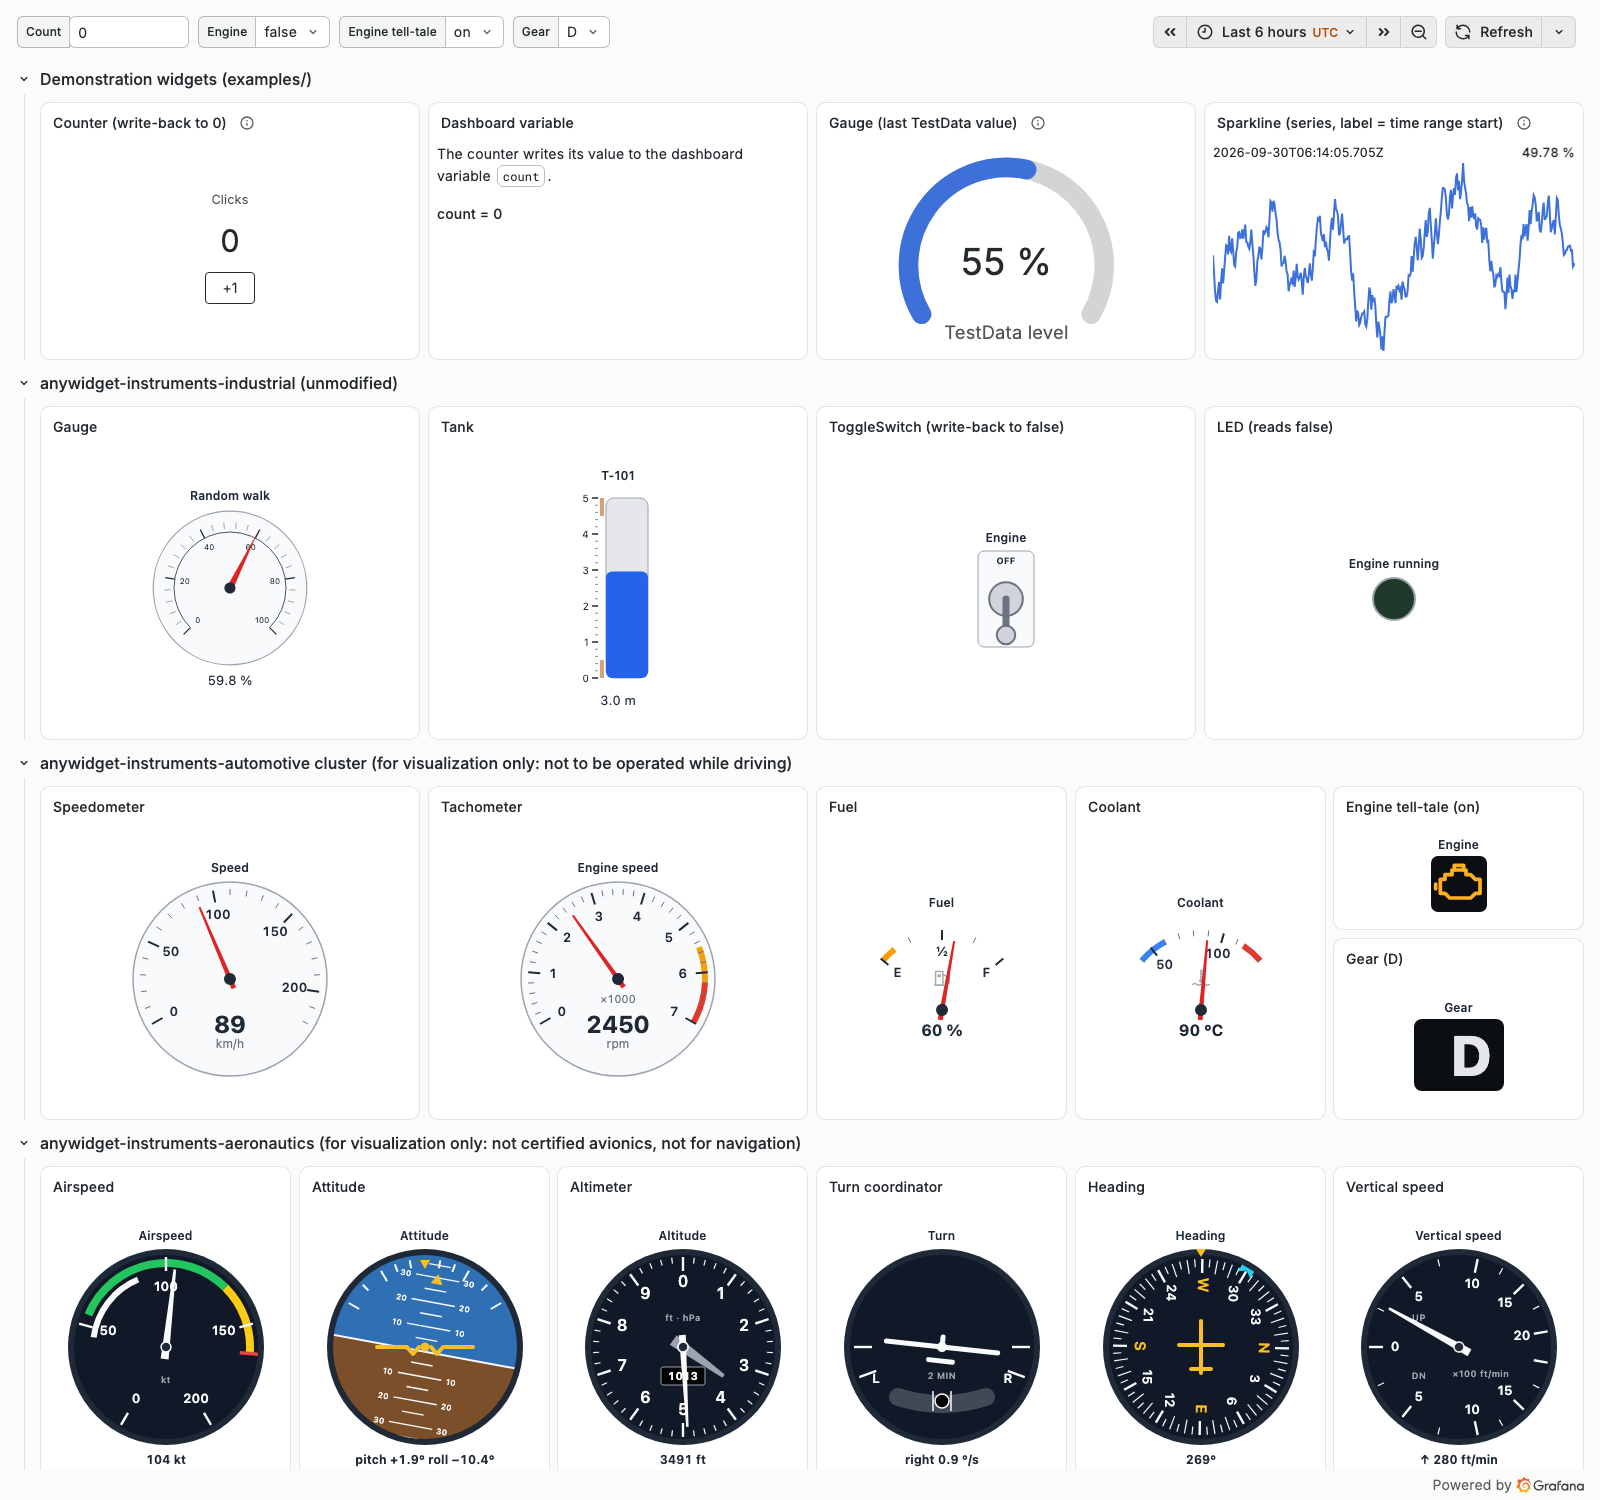
anywidget-instruments-industrial also computes some traits in the browser
(alarm_level, peak, ...) and saves them; without a binding, they are
ignored with one console warning per trait.
Version and updates
The bundled front end is the commit recorded in
src/widgets/anywidget-instruments-industrial/SOURCE.json, under its BSD-3-Clause
license. Development gives
the steps to update it.
See also
- anywidget-instruments-industrial documentation: widget catalog, trait contract, hosts, safety notice.
- anywidget-instruments-automotive: the automotive instruments, built on the same base.
- Compatibility and limits.
Safety
Like anywidget-instruments-industrial itself, these widgets are for visualization,
teaching, simulation and supervision. They are not a safety-related
system, and EmergencyStop is not an emergency stop device.