Widget catalog
At a glance
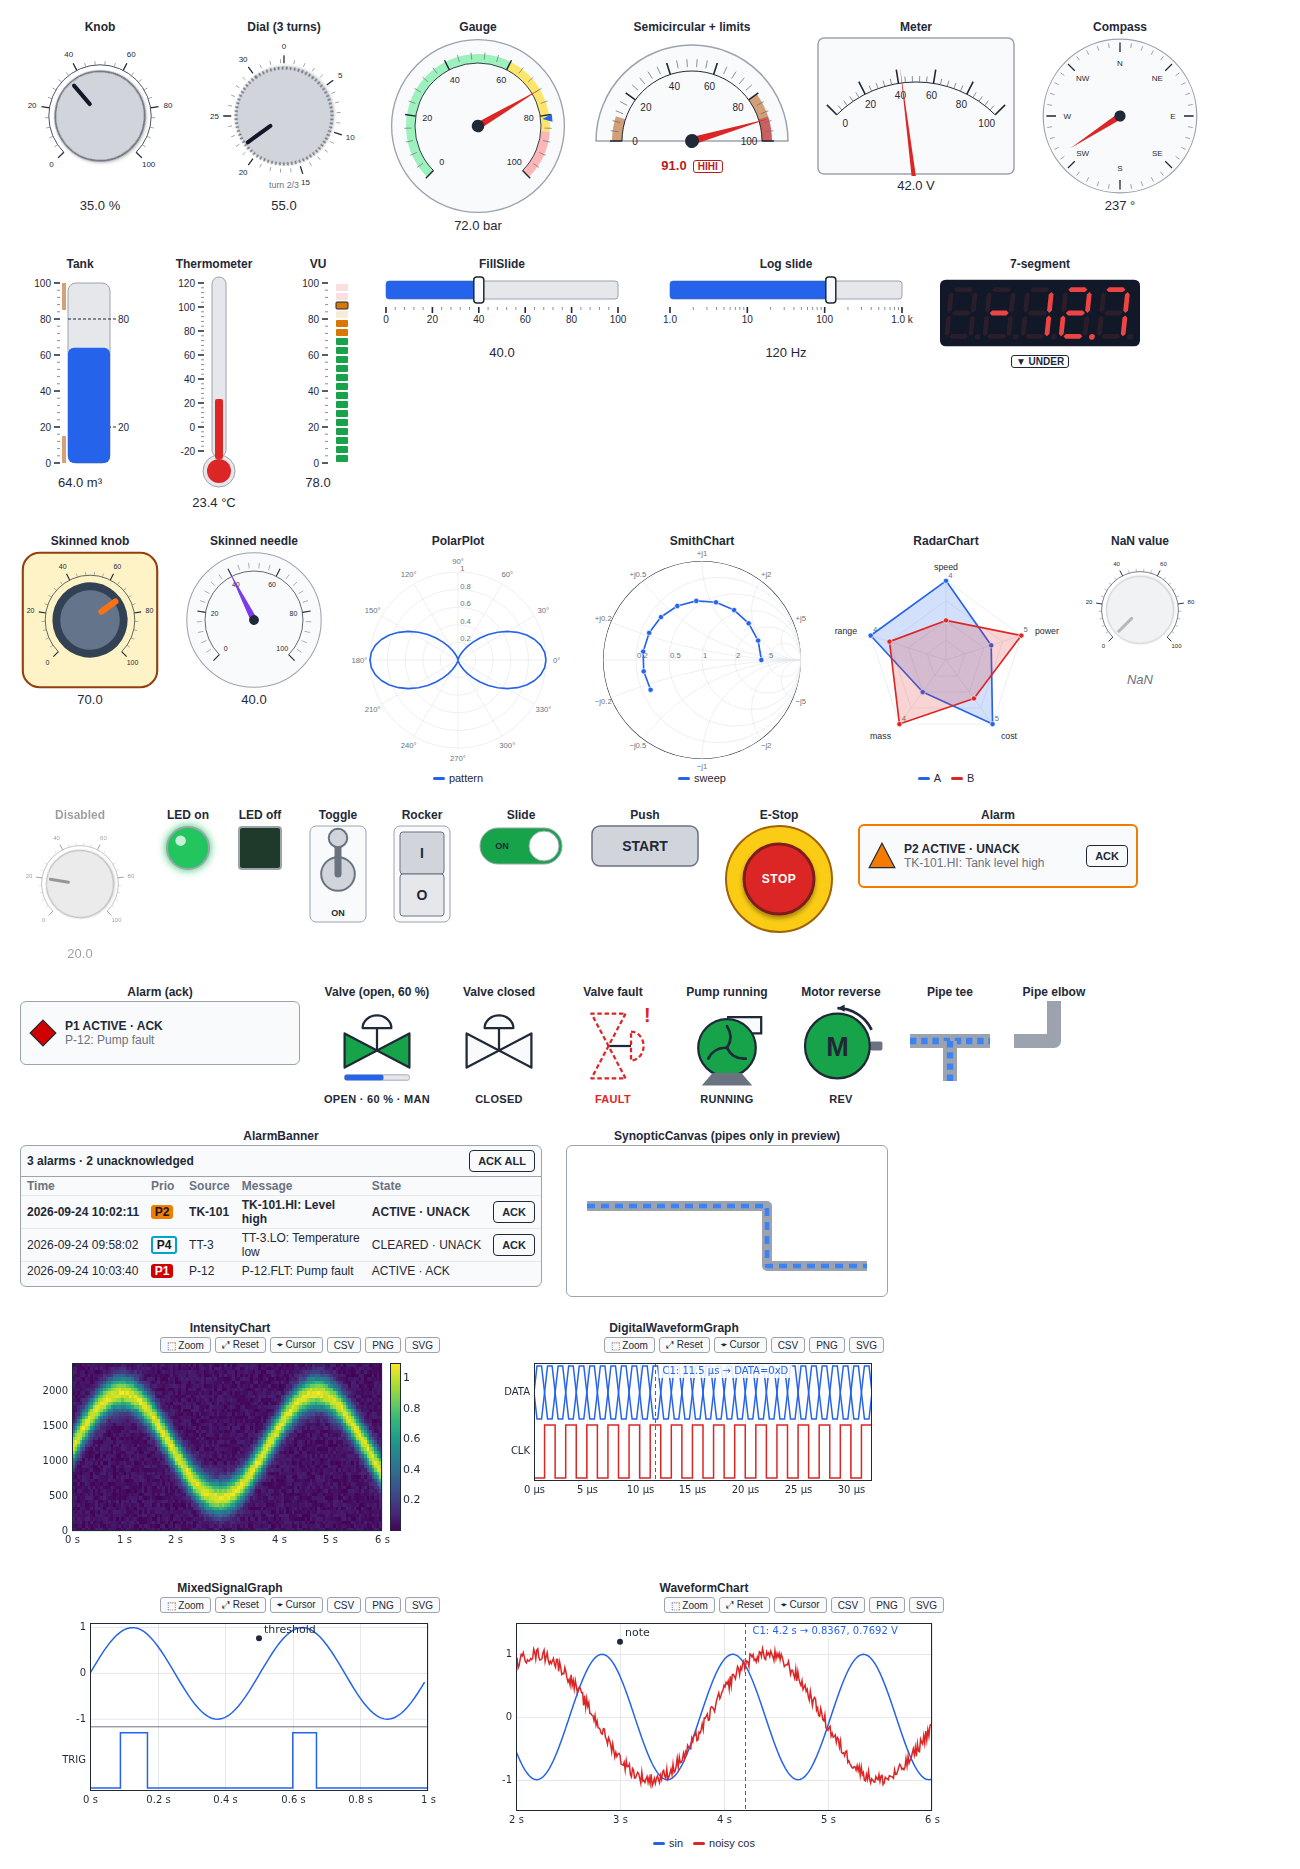
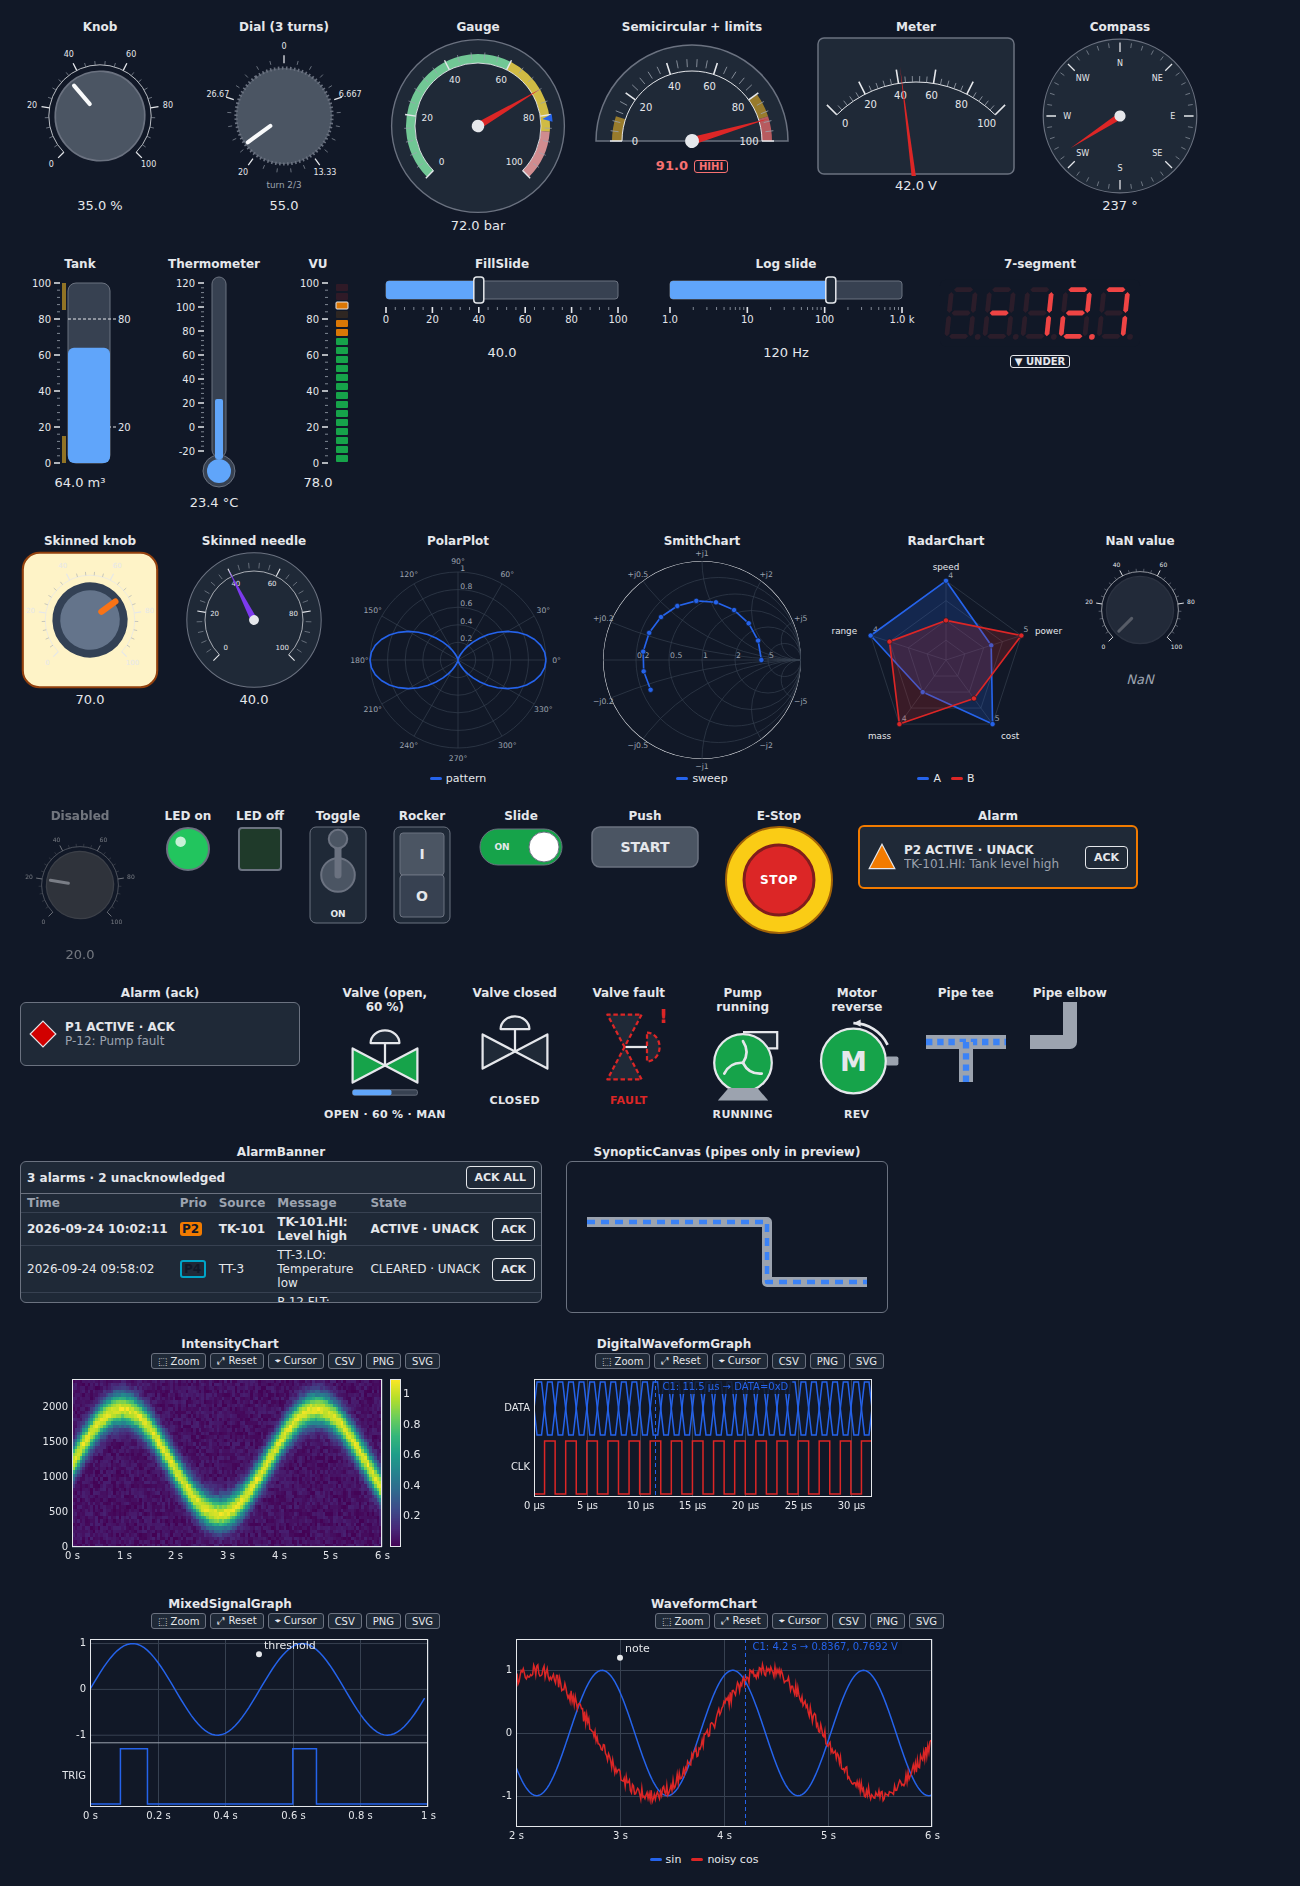
Widgets grouped by function. C = control by default, I = indicator
by default; every widget switches with mode.
| Group | Widgets | Standards followed |
|---|---|---|
| Controls, continuous | Knob (C), Dial (C), FillSlide (C), NumericEntry (C, keypad); a numeric entry field on every numeric control |
|
| Controls, discrete | PushButton (C), ToggleSwitch (C), RockerSwitch (C), SlideSwitch (C), SelectorSwitch (C), EmergencyStop (C) |
IEC 60073 (button and lamp colors) |
| Indicators, analog | Gauge, Meter, VUMeter, Tank, Thermometer, SevenSegment, Compass, AnalogIndicator (I) |
ISA-101 (AnalogIndicator) |
| Indicators, discrete | LED, StackLight, BitField (I) |
IEC 60073 |
| Graphs, time | WaveformChart, IntensityChart, DigitalWaveformGraph, MixedSignalGraph (I) |
|
| Graphs, trends | TrendChart, Sparkline (I) |
ISA-101 |
| Compact indicators | DeviationIndicator, BarGraph, KPITile (I) |
ISA-101, ISO 22400 (oee) |
| Graphs, specialized | PolarPlot, SmithChart, RadarChart, PictureControl |
|
| Alarms and events | AlarmIndicator, AlarmBanner, AlarmList, Annunciator, EventLog |
ISA-18.1, ISA-18.2 / IEC 62682 |
| Process symbols | Valve, Pump, Motor, Pipe (faceplates) |
ISA-5.1 (symbols) |
| Field instruments | Transmitter (I) |
ISA-5.1, NAMUR NE 107 |
| Supervisory objects | PIDFaceplate with PID, StateMachine |
ISA-101, ISA-TR88.00.02 |
| Recipes and plant structure | RecipeTable (C), XYGraph (I), EquipmentTree (C) |
IEC 62264, IEC 61512 (EquipmentTree levels) |
| Custom front panels | SvgPanel (C) and its templates |
|
| Layout and session | Panel, SynopticCanvas, ThemeSwitch |
There is no password or login widget: a widget cannot keep a secret and a notebook cannot enforce an access control. See why there is no password field for the reasons and what to use instead.
The sections below follow the families of the specification. The standards named in this page inspired the widgets; the library does not claim conformity with them (see Standards and references).
Numeric controls and indicators
| Widget | Default mode | Notes |
|---|---|---|
Knob |
control | angle_range |
Dial |
control | turns for multi-turn operation |
Gauge |
indicator | variant="circular"/"semicircular", colored ranges, peak_hold, setpoint |
Meter |
indicator | sector scale, peak_hold, setpoint |
VUMeter |
indicator | segments, peak_hold, peak_decay |
Tank |
indicator | markers, fill_color |
Thermometer |
indicator | bulb and fluid column |
FillSlide |
control | orientation horizontal / vertical |
SevenSegment |
indicator | digits, decimals, color |
Compass |
indicator | heading in degrees |
Boolean controls and indicators
LED (round/square, blink), ToggleSwitch, RockerSwitch,
SlideSwitch, PushButton, EmergencyStop (latches, reset()), all with
mechanical_action, confirm (two-step confirmation) and latch_timeout.
PushButton takes a cap color (BUTTON_COLORS) and shape="round" for a
panel operator. An illuminated push button has a built-in lamp: lamp=True
or False (lit or not, None for no lamp), lamp_color (LAMP_COLORS)
and lamp_blink. The program drives the lamp, independently of the button
value (BOOL-015):
start = ai.PushButton(text="START", shape="round", color="green")
running = ai.PushButton(text="RUN", shape="round", lamp=False, lamp_color="green")
start.observe(lambda ch: setattr(running, "lamp", True) if ch["new"] else None, "value")
Graphs
All graphs share cursors (add_cursor, cursor_values), annotations
(annotate), zoom (toolbar, wheel, double-click reset) and export
(CSV / PNG / SVG).
rng = np.random.default_rng(0)
t = np.arange(2000) * 1e-3
samples = np.column_stack([np.sin(2 * np.pi * 5 * t), np.cos(2 * np.pi * 5 * t)])
fs, block = 1000.0, rng.normal(size=512)  # sampling rate (Hz), one block of samples
bytes_read = rng.integers(0, 256, 64, dtype=np.uint8)  # bytes captured on a bus
v = np.sin(2 * np.pi * 1e3 * np.arange(200) * 1e-6)  # analog signal
trigger = (v > 0).astype(np.uint8)  # digital line

chart = ai.WaveformChart(
    n_traces=2, history=2000, dt=1e-3, x_unit="s", update_mode="strip", autoscale_y=True
)
chart.append(samples)  # (n_points, n_traces), sent as binary float32

spec = ai.IntensityChart(n_bins=256, y_max=fs / 2, colormap="inferno")
spec.append(np.abs(np.fft.rfft(block))[:256])

logic = ai.DigitalWaveformGraph(buses=[{"name": "DATA", "lines": [7, 6, 5, 4, 3, 2, 1, 0]}])
logic.set_data(bytes_read, n_bits=8)

mixed = ai.MixedSignalGraph(dt=1e-6)
mixed.set_analog(v)
mixed.set_data(trigger)
A WaveformChart also takes a logarithmic Y axis (y_scale="log": decade
ticks, values at or below 0 are not drawn, a y_min at or below 0 starts the
axis at y_max / 1000) and a secondary axis on the right for the traces
marked "axis": "right", with its own range (y2_min, y2_max, or
autoscale_y2) and unit (y2_unit). The legend marks those traces
"(right axis)" and the cursor readout gives each value in its own unit.
vac = ai.WaveformChart(
    n_traces=2,
    dt=1.0,
    x_unit="s",
    unit="mbar",
    y_scale="log",
    y_min=1e-4,
    y_max=1e3,
    y2_max=100,
    y2_unit="%",
    traces=[{"name": "Chamber pressure"}, {"name": "Valve opening", "axis": "right"}],
)
Named values
value_labels names values of a numeric scale: a discrete selector (OFF /
LOW / HIGH on a knob or a slide), the levels of a tank. The scale shows the
labels at their values instead of numbers, the readout shows the label of the
current value (the number between two labels), and a label can be typed in
the value field (case ignored). value_label gives the current label in
Python.
fan = ai.Knob(0, min=0, max=2, step=1, value_labels={0: "OFF", 1: "LOW", 2: "HIGH"}, label="Fan")
fan.value = 2
fan.value_label  # 'HIGH'
Setpoint pointer
A Gauge or a Meter with a setpoint draws it as a second pointer: a
dashed line ending in a hollow triangle outside the scale, distinct from the
needle by shape as well as color. The text alternative states it too
("…, setpoint 60 °C"). None (the default) hides it.
temp = ai.Gauge(57.2, max=100, unit="°C", setpoint=60, label="TIC-101")
temp.setpoint = 65  # the operator's new target, set by the kernel
Specialized displays
angles_deg = np.arange(0, 360, 5)
gain_db = 10 * np.log10(np.cos(np.radians(angles_deg) / 2) ** 2 + 1e-3)  # antenna pattern
impedances = 50 * (1 + 0.5j * np.linspace(-2, 2, 21))  # series RL sweep, ohms

polar = ai.PolarPlot(zero="N", direction="cw")
polar.plot(gain_db, angles_deg, name="pattern")

smith = ai.SmithChart(z0=50)
smith.plot(impedances, name="S11")  # complex ohms, or kind="reflection"

radar = ai.RadarChart(axes=["speed", "power", "cost"])
radar.plot([4, 3, 5], name="A")

pic = ai.PictureControl(size=(320, 200))
pic.rect(10, 10, 100, 50, fill="#3b82f6").text(20, 40, "hello").flush()
pic.on_click(lambda e: print(e["x"], e["y"]))
Supervisory objects
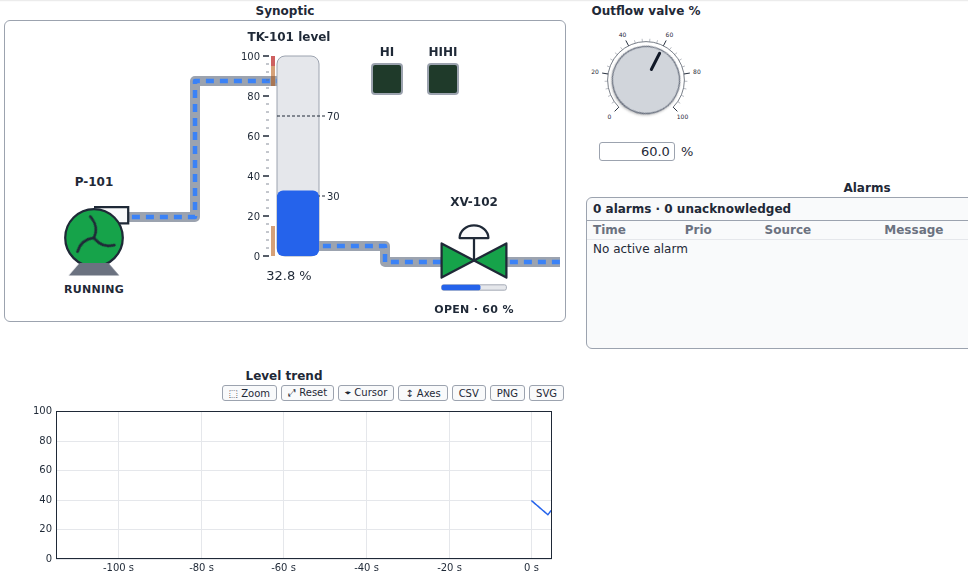
Valve, Pump, Motor (state feedback, faceplate commands with
on_command, auto/manual, optional simulate), Pipe segments,
AlarmIndicator, AlarmBanner and SynopticCanvas, which places widgets and
animated pipe runs on a background image.
Industrial operator objects
Warning
These objects present and simulate operator functions; they do not implement safety functions. See the safety notice.
Objects for control rooms and machine panels (IND-001 .. IND-066). They follow ISA-101 (grey scale in normal operation, color for abnormal situations), ISA-18.1 (annunciator sequences), ISA-18.2 / IEC 62682 (alarm management), IEC 60073 (indicator colors) and ISA-TR88.00.02 (machine state model).
import anywidget_instruments_industrial as ai

# high-performance bar: normal band, limits and target; color only in alarm
weight = ai.AnalogIndicator(
    502, min=470, max=530, unit="g", normal_lo=495, normal_hi=508, target=502, lo=490, hi=515
)

# selector and key switch
mode = ai.SelectorSwitch("AUTO", positions=["HAND", "OFF", "AUTO"])
access = ai.SelectorSwitch("LOCAL", positions=["LOCAL", "REMOTE"], keyed=True, locked=True)

# signal tower
light = ai.StackLight(tiers=["red", "amber", "green"], labels=["Fault", "Attention", "Run"])
light.set("green", "on")

# control loop: PID controller and its faceplate
loop = ai.PIDFaceplate(
    tag="TIC-101",
    unit="°C",
    pv_max=150,
    confirm_delta=10,
    controller=ai.PID(kp=2.0, ti=30.0, sp=75.0),
)
op = loop.step(pv=72.4, dt=0.5)  # call with each new measurement

# annunciator (ISA-18.1 sequence A, M or R, first out)
ann = ai.Annunciator(
    [("PAH-101", "Pressure high", "red"), ("LAL-201", "Level low")], sequence="R", first_out=True
)
ann.set("PAH-101", True)

# alarm summary with shelving, suppression and out-of-service states
alarms = ai.AlarmList()
alarms.raise_alarm("TI-101.HI", "Temperature high", source="TI-101", priority="high")
alarms.on_event(lambda e: print(e["name"], e["alarm_id"]))

# machine state model (PackML by default)
machine = ai.StateMachine()
machine.command("Reset")
machine.state_complete()  # the kernel ends acting states
| Widget | Operator actions sent to the kernel |
|---|---|
SelectorSwitch |
position (rejected while a key switch is locked) |
PIDFaceplate |
loop mode; SP in AUTO, OP in MAN, with confirmation of large changes |
Annunciator |
Silence, Acknowledge, Reset, Test (while held) |
AlarmList |
Acknowledge, Shelve (timed), Unshelve |
StateMachine |
commands valid in the current state |
Operating modes: PackML, GEMMA and ISA-88
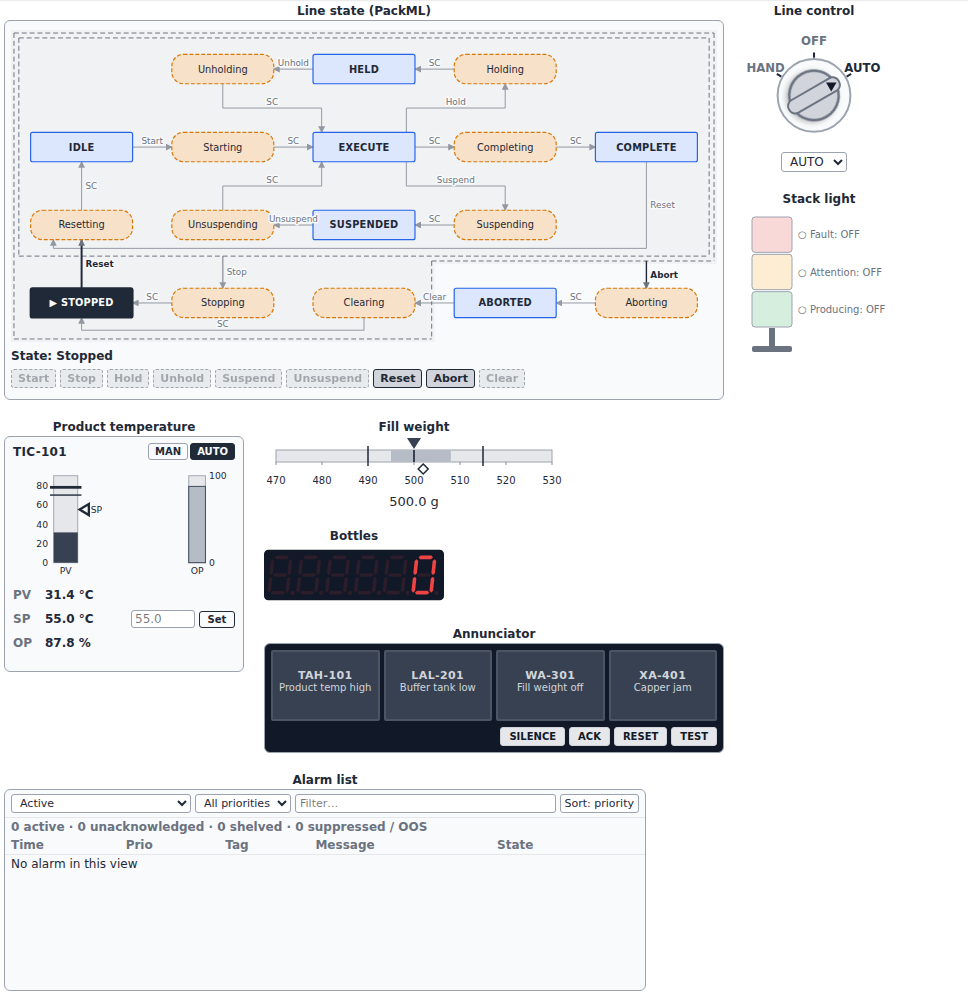
StateMachine ships three models of the running and stopping of a machine
or a process. Each is a plain dictionary, also published in the trait
contract for hosts (presets of the machine trait):
| Model | Name | Origin | What it describes |
|---|---|---|---|
PACKML_MODEL (default) |
"packml" |
ISA-TR88.00.02 (PackML) | 17 machine states and 9 commands, with acting states (Starting, Stopping, ...) that end by themselves; packaging machines and lines |
GEMMA_MODEL |
"gemma" |
GEMMA, the running and stopping modes study guide (ADEPA, 1981), widely taught in France | 16 procedures seen from the operative part: A (stop and restart), F (operation, including preparation, closing, checks and tests), D (failure, including the emergency stop and running despite a failure) |
ISA88_MODEL |
"isa88" |
ISA-88 / IEC 61512-1 (batch control) | 12 states and 8 commands of a procedural element (a phase, an operation, a unit procedure) |
gemma = ai.StateMachine("gemma", label="Drilling station", size=(760, 400))
gemma.command("Prepare")  # A1 -> F2 (preparation run)
gemma.state_complete()  # F2 -> F1 (normal production)
gemma.state_title  # 'Normal production'
gemma.path_to("A4")  # ['Stop', 'SC']: commands leading to a state
The GEMMA model draws the three families as shaded zones, gives each
procedure its title, and draws the emergency stop, possible from every
procedure but D1, as one arrow leaving a dashed zone. Its transitions are
the usual loops of the guide; a real machine keeps the procedures and loops
it needs, which a custom model (states with title and group,
global_commands, zones, routes) expresses. The D1 procedure represents the emergency stop in the
software model only: the emergency stop itself is a hardwired safety
function (see the safety notice).
How the diagram is drawn
The diagram follows the usual drawing of a state model (IND-067):
- acting states (they end by themselves, such as
Starting) are rounded, orange and dashed; wait states (such asIDLE) are square, blue and in capitals; the current state is dark and marked ▶; - every transition is an arrow made of horizontal and vertical segments,
labelled with its command, or
SC(state complete) for the end of an acting state; the arrows leaving the current state are emphasised; - a zone is a dashed outline around states. When a command of the zone leads from every state inside it to the same state, one arrow leaves the zone instead of one arrow per state: in PackML, Stop leaves the zone of the first three rows and Abort a larger, shaded zone.
A model places its states on a grid (x, y: column and row). It may
add zones (rectangles [x0, y0, x1, y1] in cell units, a state at
(x, y) filling [x, x+1] × [y, y+1]) and routes, the waypoints of an
arrow in cell units, the centre of a state being at (x + 0.5, y + 0.5).
Arrows without a route go round the states by the gaps between rows and
columns.
line = ai.StateMachine(
    {
        "states": [
            {"name": "Stopped", "x": 0, "y": 1},
            {"name": "Starting", "x": 0, "y": 0, "acting": True},
            {"name": "Running", "x": 1, "y": 0},
            {"name": "Stopping", "x": 2, "y": 0, "acting": True},
        ],
        "transitions": [
            ["Stopped", "Start", "Starting"],
            ["Starting", "SC", "Running"],
            ["Starting", "Stop", "Stopping"],
            ["Running", "Stop", "Stopping"],
            ["Stopping", "SC", "Stopped"],
        ],
        # Stop from Starting and Running: one arrow out of the zone
        "zones": [{"rects": [[0, 0, 2, 1]], "commands": ["Stop"]}],
        # Stopping back to Stopped: down, then left along the second row
        "routes": {"Stopping>Stopped": [[2.5, 1.5]]},
    },
    label="Conveyor",
    size=(480, 260),
)
The three models answer different questions. GEMMA lists what the operative part is doing, modes (production, checks, tests) and states together. ISA-88 and PackML separate the mode (automatic, semi-automatic, manual for ISA-88; production, maintenance, manual for PackML unit modes) from the state within that mode. The correspondence is therefore approximate:
| Situation | GEMMA | ISA-88 procedural state | PackML state |
|---|---|---|---|
| Stopped, ready to start | A1 | Idle | Idle |
| Start-up, warm-up | F2 | Running (start of the procedure) | Starting |
| Normal production | F1 | Running | Execute |
| Stop at the end of the cycle | A2, then A1 | Complete (end of the procedure) | Completing, then Complete |
| Stop in a given state, then restart | A3, A4, then F1 | Pausing, Paused, Resume; or Holding, Held, Restart | Holding, Held, Unholding |
| Waiting for upstream or downstream | not distinguished (a condition of F1) | not distinguished | Suspending, Suspended, Unsuspending |
| Closing run (emptying the machine) | F3 | end of the procedure | Completing |
| Checks and tests | F4, F5, F6 | manual or semi-automatic mode | maintenance or manual unit mode |
| Controlled stop | A2 or A3 | Stopping, Stopped | Stopping, Stopped |
| Failure diagnosis | D2 | Holding, Held (exception handling) | Holding, Held; or Aborting |
| Running despite a failure | D3 | not modeled | not modeled |
| Emergency stop | D1 | Aborting, Aborted | Aborting, Aborted |
| Back to the initial state after a failure | A5, A6 (or A7 then A4) | Reset to Idle | Clearing, Stopped, Resetting, Idle |
The operating modes demo of the examples runs the three models side by side.
Trends, instruments and compact indicators
Objects of supervision screens (IND-070 .. IND-104).
TrendChart
Named pens against wall-clock time, each on its own scale; the vertical axis
shows the scale of the selected pen (click its legend entry). Alarm limits
are dashed lines and the setpoint a dotted line. The chart follows the latest
data (● LIVE); the ◀ ▶ buttons, the zoom and the span list browse the
history (❚❚ HISTORY) until ● Live is pressed. Times are Unix seconds and
travel as binary float64; cursors and axis fields take local times
(HH:MM:SS or YYYY-MM-DD HH:MM:SS).
import time

trend = ai.TrendChart(
    pens=[
        {"name": "LT-101", "unit": "m", "min": 0, "max": 4, "hi": 3.0, "setpoint": 2.2},
        {"name": "FT-101", "unit": "L/s", "min": 0, "max": 60},
    ],
    span=600,  # seconds shown in live mode
)
trend.add("LT-101", 2.31)  # now
trend.add_many({"LT-101": 2.32, "FT-101": 24.0})
timestamps = time.time() - np.arange(60, 0, -1)  # the last minute
trend.add("FT-101", 20 + np.sin(timestamps / 10), time=timestamps)  # arrays
times, values = trend.data("LT-101")
Transmitter
An instrument bubble in the manner of ISA-5.1 (function letters above the
line, loop number below), with the value, and the device status after the
NAMUR NE 107 categories, each with its own symbol and text: ok,
failure (✕ FAILURE, the value shows ✕ BAD), check (▲ FUNCTION CHECK),
out_of_spec (? OUT OF SPEC) and maintenance (◆ MAINTENANCE). Alarm limits work as on the other numeric widgets.
lt = ai.Transmitter(2.41, tag="LT-101", unit="m", max=4, hi=3.0, hihi=3.5)
lt.status = "maintenance"
lt.status_text = "sensor drift"
if lt.valid:  # False while the status is "failure"
    level = lt.value
EventLog
A journal of events, newest first, with time, category (operator,
state, alarm, system, shown as text chips), source and message; the
operator filters it by category and text and downloads it as CSV. At most
max_events events are kept. connect() records every change of the named
traits of other widgets: an audit trail of operator actions.
setpoint = ai.Knob(2.2, max=4, step=0.1, unit="m", label="Level setpoint")
pump_mode = ai.SelectorSwitch("AUTO", positions=["HAND", "OFF", "AUTO"])

log = ai.EventLog(max_events=1000)
log.log("Pump P-101 started", source="P-101", category="state")
log.connect(setpoint, category="operator")  # "value: 2.2 → 2.4"
log.connect(pump_mode, category="operator", source="Pump mode")
log.events  # list of dicts, oldest first
DeviationIndicator
A centre-zero bar of the deviation between a value and its setpoint, over
±span. The tolerance band ±tolerance is shaded; inside it the bar is
grey, outside it the bar takes the alarm color and reads ▲ HIGH or
▼ LOW. The signed deviation is written next to the bar.
dev = ai.DeviationIndicator(52.3, setpoint=50, tolerance=1.5, span=5, unit="°C")
dev.deviation, dev.out_of_tolerance  # (2.3, True)
Sparkline
A small trend without axes of the last history values, with the last
value written next to it and the minimum (hollow dot) and maximum (filled
dot) marked. Values travel as binary buffers.
spark = ai.Sparkline(history=60, unit="m", format="%.2f")
spark.append(2.31)  # one value
spark.append(np.linspace(2.0, 2.4, 30))  # or many
BarGraph
Aligned bars on a shared scale, one per bars entry (a label, or a dict
with label, normal_lo, normal_hi, lolo, lo, hi, hihi). Bars are
grey with the normal band shaded and the limits marked; a bar in alarm is
drawn in the alarm color and labelled with its level. alarm_levels gives
the level of each bar.
zones = ai.BarGraph(bars=["Z1", "Z2", {"label": "Z3", "hi": 80}], unit="°C", max=100)
zones.value = [62.0, 64.5, 83.1]
zones.alarm_levels  # ['normal', 'normal', 'hi']
KPITile
A key performance indicator: the value, the target and the difference to
the target with its direction (▲ / ▼) and whether it is on the good side
(✓ / ✗, after higher_is_better), with an optional sparkline of the last
history values. oee(availability, performance, quality) computes the
overall equipment effectiveness in the manner of ISO 22400.
tile = ai.KPITile(unit="%", target=85, label="OEE")
tile.append(ai.oee(0.9, 0.95, 0.99) * 100)  # 84.6 %, "▼ -0.4 % vs target 85.0 % ✗"
NumericEntry
A numeric keypad with a display, for touch panels. The operator types a
value on the keys or the keyboard (digits, ., -, Backspace, Delete);
Enter commits it after the range check of the numeric controls, Escape
discards it. With confirm_delta, a change larger than that asks for a
second Enter.
sp = ai.NumericEntry(2.2, min=0, max=4, unit="m", label="Level setpoint", confirm_delta=0.5)
Registers, recipes and plant structure
Hexadecimal, binary and octal display
Every numeric widget takes %X / %x (hexadecimal), %b (binary) and %o
(octal) formats, with a zero-padded width such as %04X or %016b: the value
is shown as an integer in that base, on its readout and its scale. The entry
field and the keypad then take values typed in that base (the keypad shows A
to F in hexadecimal); 0x, 0b and 0o prefixes are accepted everywhere.
reg = ai.NumericEntry(0x1F, min=0, max=0xFFFF, format="%04X", label="Holding register 40001")
BitField
A status or fault word as a row of lamps, one per bit, most significant bit
first, with the word in hexadecimal. Each bit has a label (bits without one are
dimmed) and an optional on color; the lamp also shows 1 or 0, so that the
state does not rely on color. In control mode a click on a bit toggles it and
sends the new word.
status = ai.BitField(
    0x0013,
    bits=16,
    label="Drive status word",
    labels=["Ready", "Running", "Warning", "", "Fault"],
    colors=["", "", "#f59e0b", "", "#dc2626"],
)
status.bit(4)  # True
status.active_labels()  # ['Ready', 'Running', 'Fault']
status.set_bit(2)  # sets the warning bit
RecipeTable
A table of typed columns whose rows the operator edits: a batch recipe, a
table of setpoints, test parameters. A column is a number (unit, limits, step,
display format), a choice among values, a Boolean or a text; readonly
columns are shown but not edited. In control mode each confirmed cell is
checked against its column with the rules of the numeric entry fields (a
value outside the limits is refused with a message naming them, a number is
snapped to step), then checked again by the kernel; on_edit callbacks get
each edit. With row_edit the operator also adds and deletes rows. Clicking a
column title sorts the displayed rows; value keeps its order.
recipe = ai.RecipeTable(
    columns=[
        {"name": "step", "type": "text"},
        {"name": "temp", "title": "Temperature", "unit": "°C", "min": 20, "max": 90, "step": 0.5},
        {"name": "time", "title": "Hold time", "unit": "min", "min": 0, "max": 240, "step": 1},
        {"name": "agitator", "type": "choice", "choices": ["off", "slow", "fast"]},
        {"name": "vacuum", "type": "bool"},
    ],
    value=[
        {"step": "Heat", "temp": 65, "time": 30, "agitator": "slow"},
        {"step": "React", "temp": 82.5, "time": 120, "agitator": "fast", "vacuum": True},
    ],
    row_edit=True,
    label="Recipe PR-12",
)
recipe.on_edit(lambda e: print(e["action"], e["row"], e["column"], e["value"]))
recipe.set_cell(0, "temp", 70)  # checked against the column, like an operator entry
XYGraph
Data sets of (x, y) pairs with arbitrary spacing: the characteristic curve of
a pump or a valve, an I-V curve, a scatter plot, measurements at irregular
points. Each set is drawn as a line, markers, both, steps (a value held until
the next x) or bars from zero. The axes follow the data unless x_min,
x_max, y_min, y_max are set. The graph has the cursors, annotations,
zoom, axis ranges and export of the other graphs; a cursor reads the value of
every set at its x, interpolated between the points sorted by x.
import numpy as np

curve = ai.XYGraph(x_unit="m³/h", unit="m", label="Pump P-101")
q = np.linspace(0, 120, 25)
curve.plot(q, 42 - 0.002 * q**2, name="Head (catalogue)")
curve.plot([30, 60, 90], [40.5, 35.0, 26.3], name="Measured", style="markers")
curve.add_cursor(75)
EquipmentTree
A hierarchy of equipment for navigating a plant model: enterprise, site,
area, unit, equipment module, control module (as in IEC 62264 and IEC 61512),
or any other hierarchy. Each node has a label, an optional level shown next
to it and an optional status (normal, running, stopped, offline,
maintenance, warning, alarm, fault) shown as a symbol and a word. A
collapsed node also shows the most severe status below it ("◆ alarm below"),
so that a fault deep in the tree stays visible.
The operator expands and collapses nodes with the arrow, a double click or
the arrow keys, and selects one with a click or Enter; the selection
(value, the id of the node) and the open nodes (expanded) are sent to the
kernel. A node without an id is identified by the path of labels from the
root.
tree = ai.EquipmentTree(
    nodes=[
        {
            "label": "Plant",
            "level": "site",
            "children": [
                {
                    "label": "Mixing",
                    "level": "area",
                    "children": [
                        {"label": "Mixer M-101", "level": "unit", "status": "running"},
                        {
                            "id": "P-102",
                            "label": "Pump P-102",
                            "level": "equipment",
                            "status": "alarm",
                        },
                    ],
                },
            ],
        },
        {"label": "Utilities", "level": "area", "status": "warning"},
    ],
    label="Plant model",
)
tree.on_change(lambda change: print("selected", change["new"]))
tree.select("P-102")  # expands Plant and Mixing
tree.rollup("Plant")  # 'alarm'
tree.set_status("P-102", "normal")
SVG faceplates
SvgPanel shows a front panel drawn freely in a vector editor (Inkscape or
any editor that writes SVG) and animates it from Python: a voltmeter, a
machine panel, the front of an instrument, with exactly the look you drew.
Elements become live by their label; everything else is decoration.
The role convention
Give an element the label awi:<role>=<name>, followed by
;<option>=<value> pairs. In Inkscape, set it in Object ▸ Object
Properties ▸ Label (stored as inkscape:label); in a hand-written SVG, use
a data-awi attribute. The element is then bound to panel["<name>"].
| Role | Element does | Options (default) |
|---|---|---|
text |
shows the value (numbers formatted, text as is, — when missing) |
format (%.1f), unit |
rotate |
turns between two angles, like a needle | min (0), max (100), from (-135), to (135) in degrees; pivot cx, cy, else the rotation center set in the editor, else the element center |
scale |
grows from one edge, like a liquid level | min (0), max (100), edge (bottom; or top, left, right) |
show |
is visible when the value is true, or equals eq |
eq |
state |
a group whose children labelled awi:case=<value> are shown only for that value |
|
color |
fill color when the value is true (or equals eq), else the off color |
on (green), off (grey), eq |
button |
control: a click, Enter or Space toggles a Boolean | label |
momentary |
control: true while pressed (pointer, Space or Enter held) | label |
set |
control: writes value (a number, true / false, or a text) |
value, label |
step |
control: one step up per click or Up arrow, down with Shift+click or Down arrow, within min, max; also gets an entry field |
step (1), min (0), max (100), label, unit, format (%.1f) |
A value is true when it is True, a non-zero number, or a word other than
0, false, off, no. Controls work in control mode (the default): they
are focusable, operable with the keyboard, and carry an ARIA role and name
(label, else the value name). The kernel refuses a step value outside its
limits, as for the numeric widgets.
The drawing is sanitized: scripts, event handlers and external resources are
removed, so a panel can neither run code nor load anything from the network.
Labels with an unknown role or an invalid option are listed in problems
(and under the panel), and the rest of the panel still works.
svg = """<svg xmlns="http://www.w3.org/2000/svg" viewBox="0 0 220 90">
  <rect width="220" height="90" rx="8" fill="#d1d5db"/>
  <rect x="12" y="14" width="110" height="34" rx="4" fill="#111827"/>
  <text x="112" y="38" text-anchor="end" font-family="monospace" font-size="18" fill="#34d399"
        data-awi="awi:text=vout;format=%.2f;unit=V">0.00 V</text>
  <circle cx="170" cy="31" r="14" fill="#374151" data-awi="awi:color=output;on=#22c55e"/>
  <rect x="12" y="58" width="50" height="22" rx="4" fill="#6b7280" data-awi="awi:button=output;label=Output"/>
  <rect x="140" y="58" width="68" height="22" rx="4" fill="#6b7280"
        data-awi="awi:step=vout;step=0.5;min=0;max=30;unit=V;label=Voltage"/>
</svg>"""  # or open("power_supply.svg").read(), drawn in a vector editor
panel = ai.SvgPanel(svg, label="Power supply", size=(420, 220))
panel.problems  # [] when every label is understood
panel["vout"] = 12.0  # indicators follow
panel.on_change(lambda change: print(change["new"]))  # controls report here
Templates
Five drawings ship with the package, with the same behavior and different
looks. Load one with SvgPanel.template(name), or copy it from
anywidget_instruments_industrial/templates/ as a starting point for your own:
| Template | Values |
|---|---|
voltmeter |
value in volts (0 to 10) |
pressure_gauge |
value in bar (0 to 10, red zone above 8) |
pilot_lamp |
value (Boolean, also toggled by a click on the lens), caption |
selector |
value 0, 1, 2 (OFF, HAND, AUTO: click a position), mode (text) |
tank |
value level in %, high (alarm lamp), fill and drain (push buttons, true while pressed) |
lamp = ai.SvgPanel.template("pilot_lamp", size=(140, 190))
lamp.update(value=True, caption="Pump P-101")