RadarChart
Multi-axis (spider) chart (SPEC-004).
Graphs, specialized · Widget catalog · API reference ·
schema radar.schema.json
Example
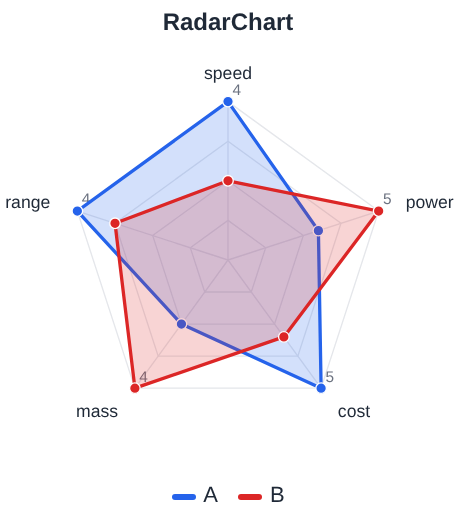
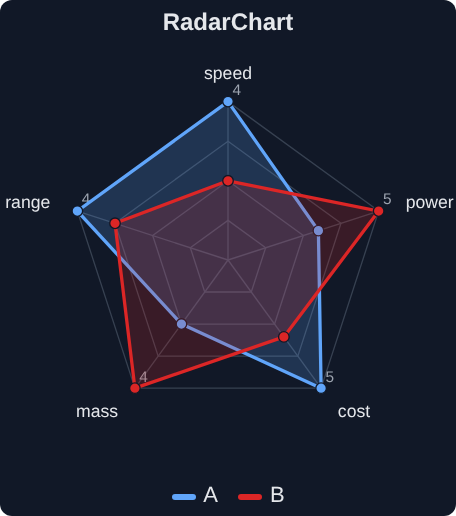
The traits of the picture above:
ai.RadarChart(
    value=[
        {"name": "A", "color": "", "values": [4, 3, 5, 2, 4]},
        {"name": "B", "color": "", "values": [2, 5, 3, 4, 3]},
    ],
    label="RadarChart",
    axes=["speed", "power", "cost", "mass", "range"],
    size=(220, 220),
)
Traits
| Trait | Type | Default | Set by | Description |
|---|---|---|---|---|
value |
array of object | [] |
host | Data sets {name, color, values}. |
axes |
array of string | [] |
host | Axis names; empty: axes numbered from the longest data set. |
ranges |
array of array | [] |
host | [min, max] per axis, max > min; an axis without a valid range goes from 0 to the largest value of the data sets. |
fill |
boolean | true |
host | Fill the data set polygons. |
Common traits (10), shared with other widgets
| Trait | Type | Default | Set by | Description |
|---|---|---|---|---|
mode |
"control", "indicator" |
"indicator" |
host | "control": the user sets the value; "indicator": display only. |
label |
string | "" |
host | Plain text, never interpreted as HTML (SEC-002). |
disabled |
boolean | false |
host | Greyed out, input rejected. |
visible |
boolean | true |
host | |
tooltip |
string | "" |
host | Plain text shown on hover. |
size |
array | [260,260] |
host | [width, height] in CSS pixels. |
style |
"modern", "classic", "system" |
"modern" |
host | |
theme |
"auto", "light", "dark", "system" |
"auto" |
host | "auto": the style decides; "system": the host page or the operating system (STYLE-007). |
skin |
object | {} |
host | Replaceable drawing parts: part name -> SVG source, sanitized (STYLE-005, STYLE-006). |
show_legend |
boolean | true |
host |
Set by: host, the program (Python, Julia, ...); widget, the user through the widget;
derived, computed from other traits by the host that owns the state, or by the widget.
See the trait contract.