WaveformChart
Scrolling multi-trace chart fed with binary samples (CHART-001 .. CHART-009).
Graphs, time · Widget catalog · API reference ·
schema waveformchart.schema.json
Example
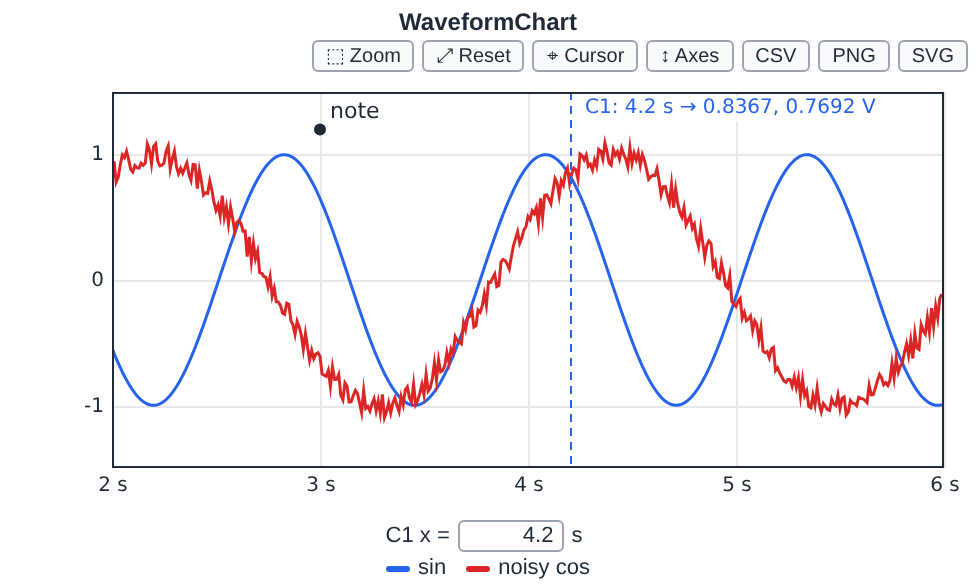
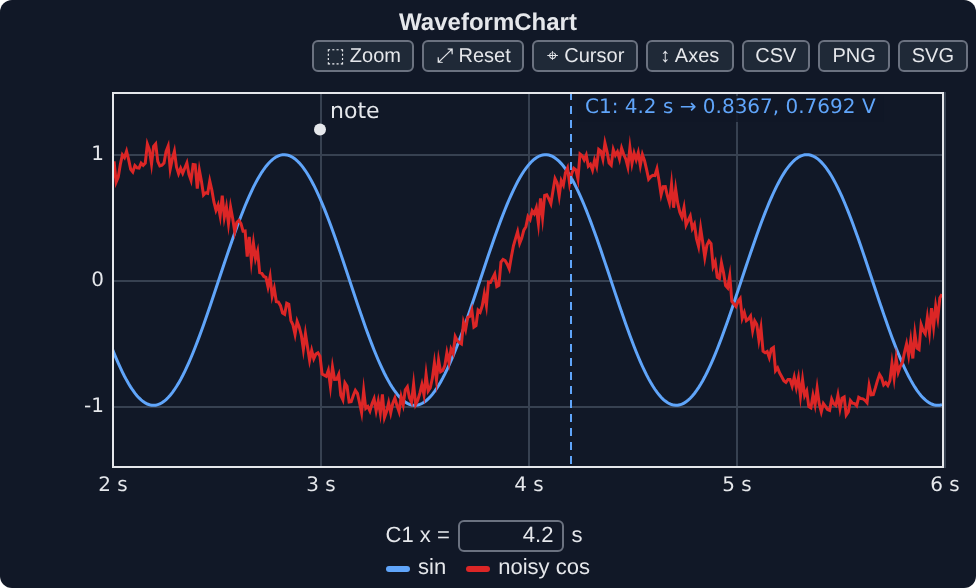
The traits of the picture above:
ai.WaveformChart(
    label="WaveformChart",
    history=400,
    n_traces=2,
    y_min=-1.5,
    y_max=1.5,
    dt=0.01,
    x_unit="s",
    unit="V",
    traces=[{"name": "sin"}, {"name": "noisy cos"}],
    cursors=[{"x": 4.2, "name": "C1", "color": ""}],
    annotations=[{"x": 3, "y": 1.2, "text": "note", "color": ""}],
    size=(480, 220),
)
The data of the picture (samples, history or drawing) is sent with the widget's methods, not as traits: see the widget catalog.
Traits
| Trait | Type | Default | Set by | Description |
|---|---|---|---|---|
value |
array of any | [] |
host | Latest sample of each trace, written by the host with each append. |
history |
integer | 1024 |
host | Points kept and shown per trace. |
n_traces |
integer | 1 |
host | |
update_mode |
"strip", "scope", "sweep" |
"strip" |
host | strip: continuous scroll; scope: fill then restart; sweep: a moving cursor overwrites the oldest data. |
y_min |
number | -1 |
host, widget | Y range when autoscale_y is off; set by the operator with the axes panel. |
y_max |
number | 1 |
host, widget | |
autoscale_y |
boolean | false |
host, widget | |
y_scale |
"linear", "log" |
"linear" |
host | Scale of the left Y axis; on a logarithmic axis values <= 0 are not drawn, and a range reaching 0 or below starts at y_max / 1000 (IND-117). |
y2_min |
number | 0 |
host | Range of the secondary axis on the right, for the traces with axis right, when autoscale_y2 is off (IND-117). |
y2_max |
number | 1 |
host | |
autoscale_y2 |
boolean | false |
host | |
y2_unit |
string | "" |
host | Unit of the secondary axis, shown under it and after the values of its traces under a cursor. |
paused |
boolean | false |
host | Freeze the display; samples keep arriving (CHART-009). |
dt |
number | 1 |
host | Sample interval in x-axis units; 0 is shown as 1. |
traces |
array of object | [] |
host | Optional style of each trace {name, color, width, visible, axis}. |
show_legend |
boolean | true |
host |
Common traits (15), shared with other widgets
| Trait | Type | Default | Set by | Description |
|---|---|---|---|---|
mode |
"control", "indicator" |
"indicator" |
host | "control": the user sets the value; "indicator": display only. |
label |
string | "" |
host | Plain text, never interpreted as HTML (SEC-002). |
disabled |
boolean | false |
host | Greyed out, input rejected. |
visible |
boolean | true |
host | |
tooltip |
string | "" |
host | Plain text shown on hover. |
size |
array | [480,240] |
host | [width, height] in CSS pixels. |
style |
"modern", "classic", "system" |
"modern" |
host | |
theme |
"auto", "light", "dark", "system" |
"auto" |
host | "auto": the style decides; "system": the host page or the operating system (STYLE-007). |
skin |
object | {} |
host | Replaceable drawing parts: part name -> SVG source, sanitized (STYLE-005, STYLE-006). |
cursors |
array of object | [] |
host, widget | Cursors {x, name, color} (CHART-104). Dragged or typed by the operator, also on indicators; a host may complete a missing name as C |
cursor_values |
array of object | [] |
host | Readout of the cursors for the host program, {name, x, values}, computed by the host from its data. The front end draws its own readout and does not read this trait. |
annotations |
array of object | [] |
host | Text annotations {x, y, text, color} in data coordinates (CHART-105). |
export |
boolean | true |
host | Offer CSV, PNG and SVG downloads in the toolbar (CHART-107). |
x_unit |
string | "" |
host | |
unit |
string | "" |
host |
Set by: host, the program (Python, Julia, ...); widget, the user through the widget;
derived, computed from other traits by the host that owns the state, or by the widget.
See the trait contract.