Examples
Every example is a marimo notebook that runs in your browser, through Pyodide, with no installation: click a picture or its button. The first load downloads Python and the widgets, which takes a few seconds.
Instrument cluster
Pick a drivetrain — combustion, hybrid or electric — and drive with the sliders: speed, engine speed, electric power, fuel or charge, coolant temperature. Light the tell-tales, pick a unit system, and turn on the head-up display. The tell-tales take their colour from their meaning (red, amber, green, blue) and move to the front when lit; the speedometer rounds up after converting; the tachometer has its red zone and shift light; the trip computer gives the consumption per hour below 5 km/h and per 100 km above, and the gear indicator follows the speed.
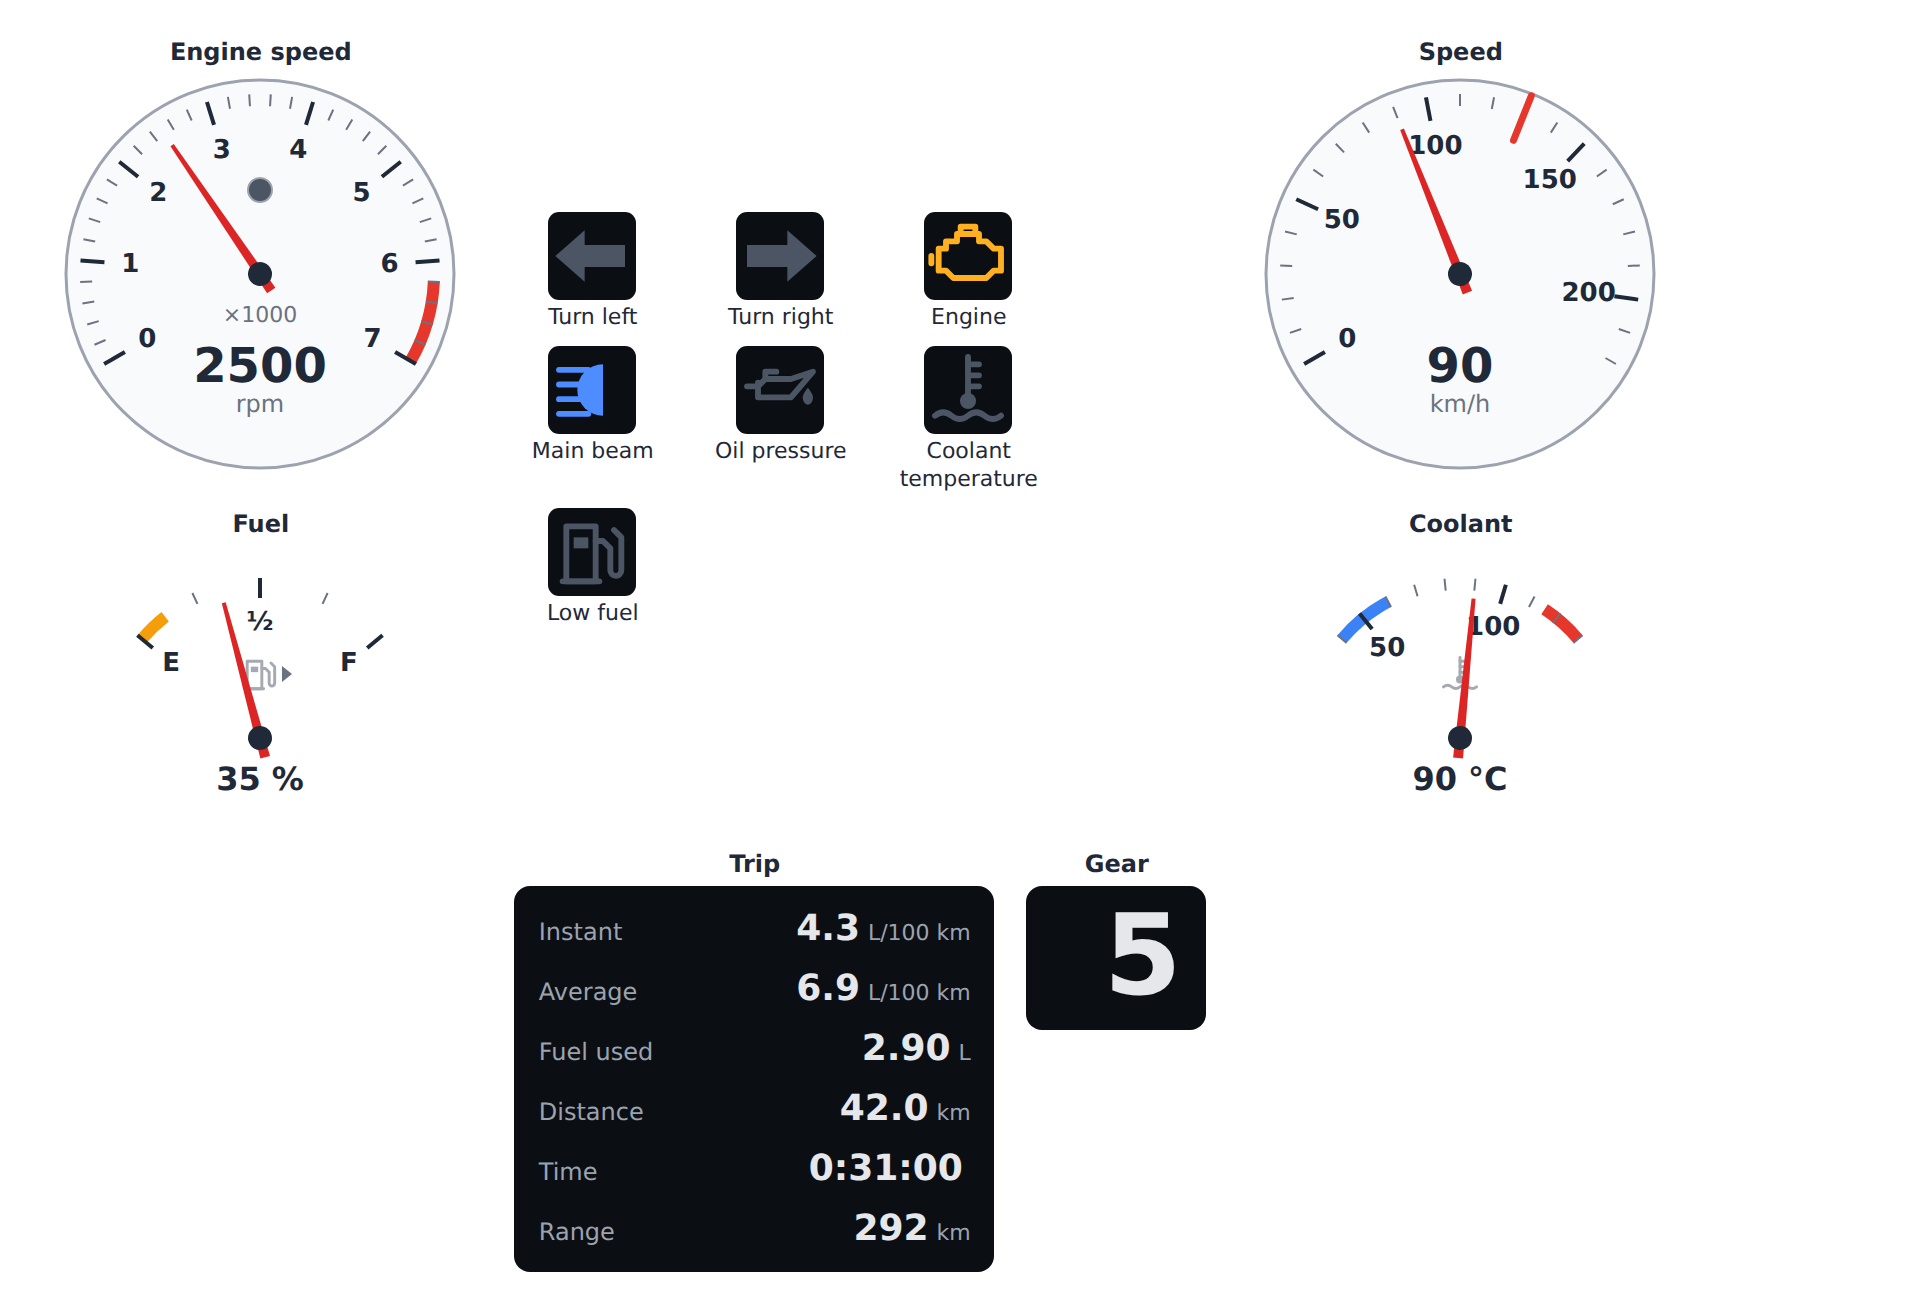
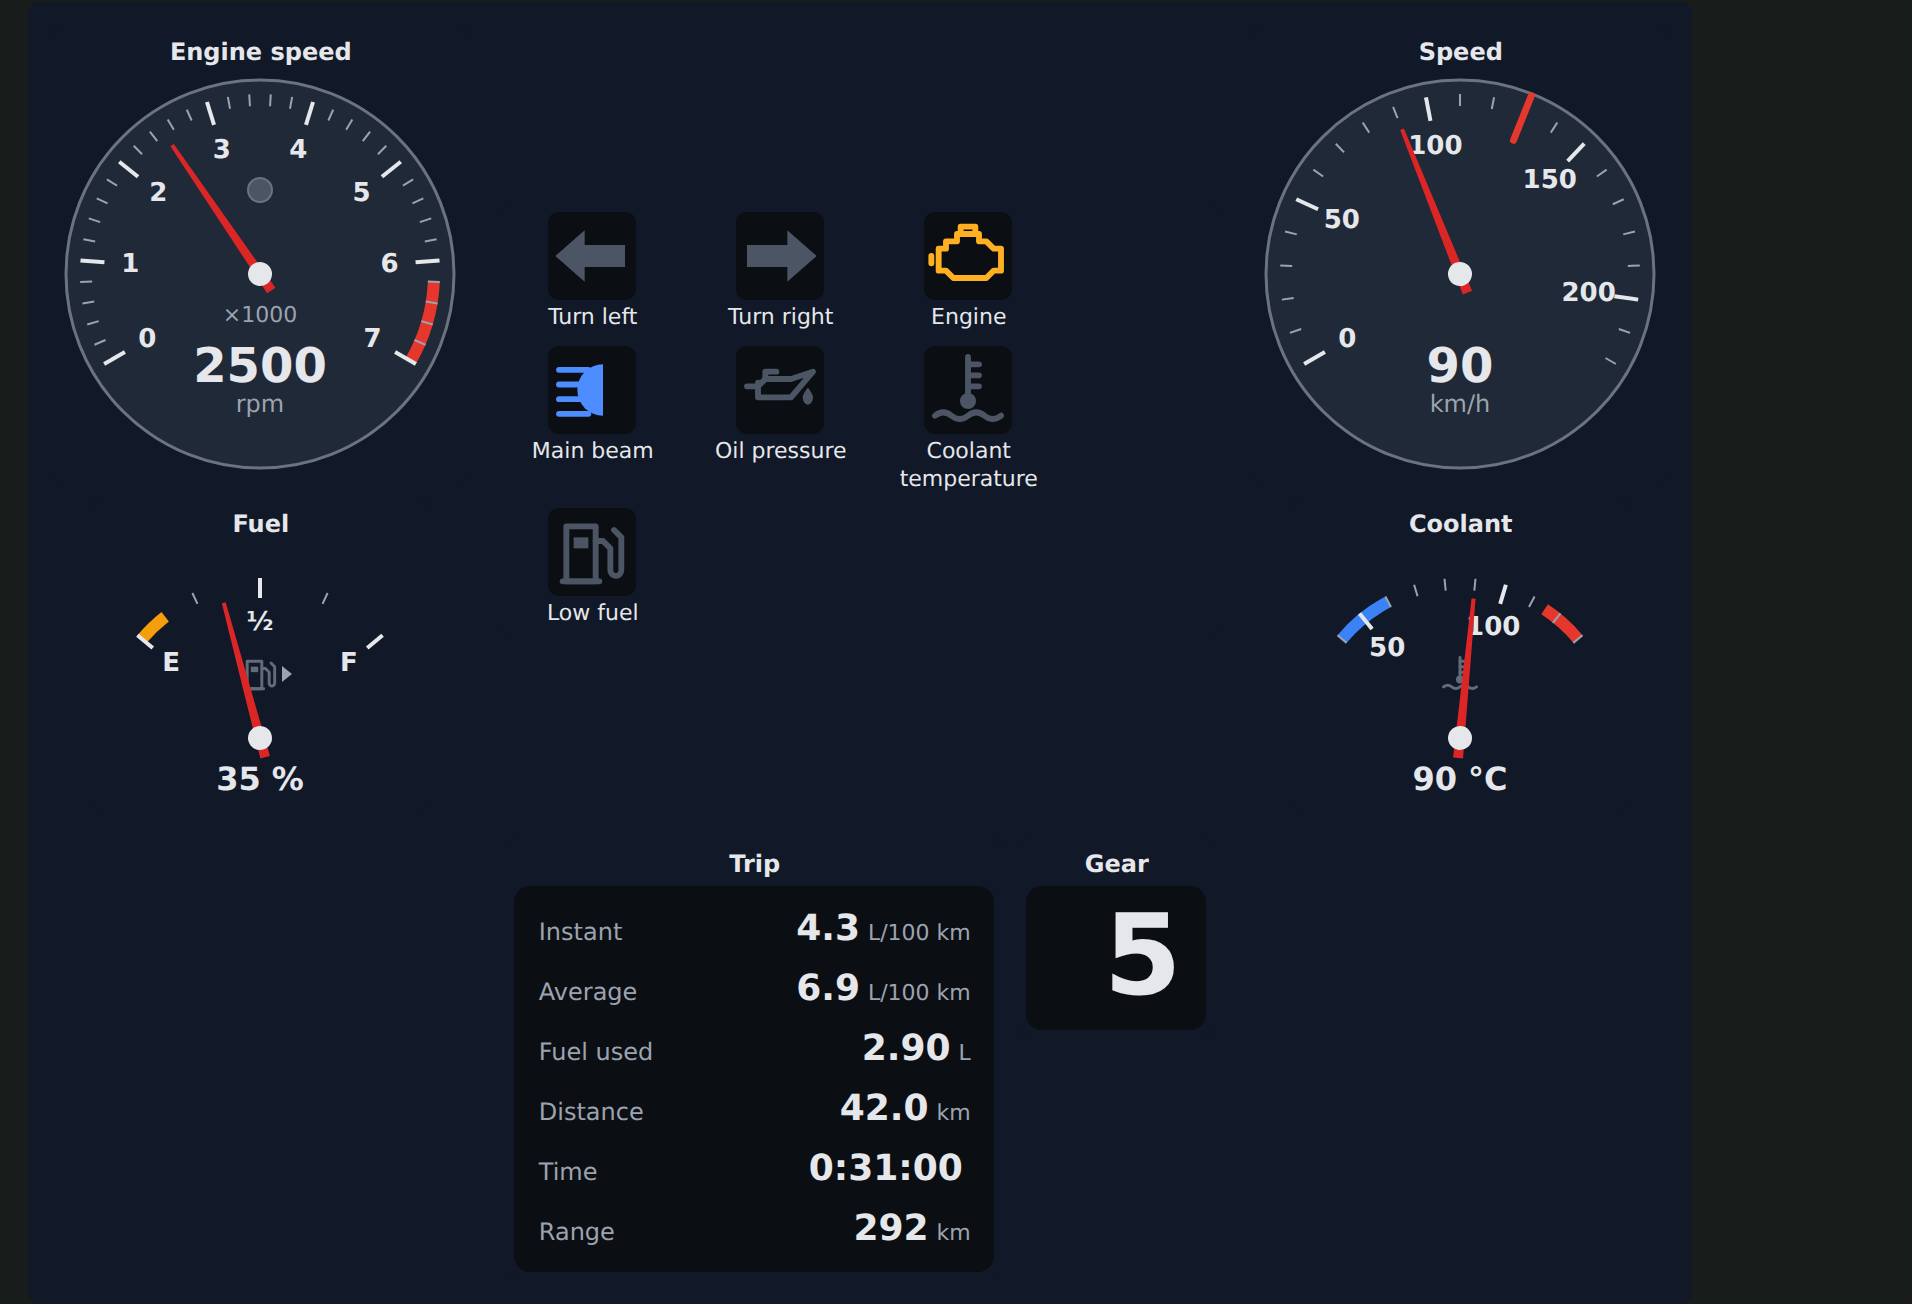
The cluster of a combustion car, with the engine tell-tale (amber) and the high beam (blue) lit. The page and the widgets follow your light or dark preference.
Electric and hybrid
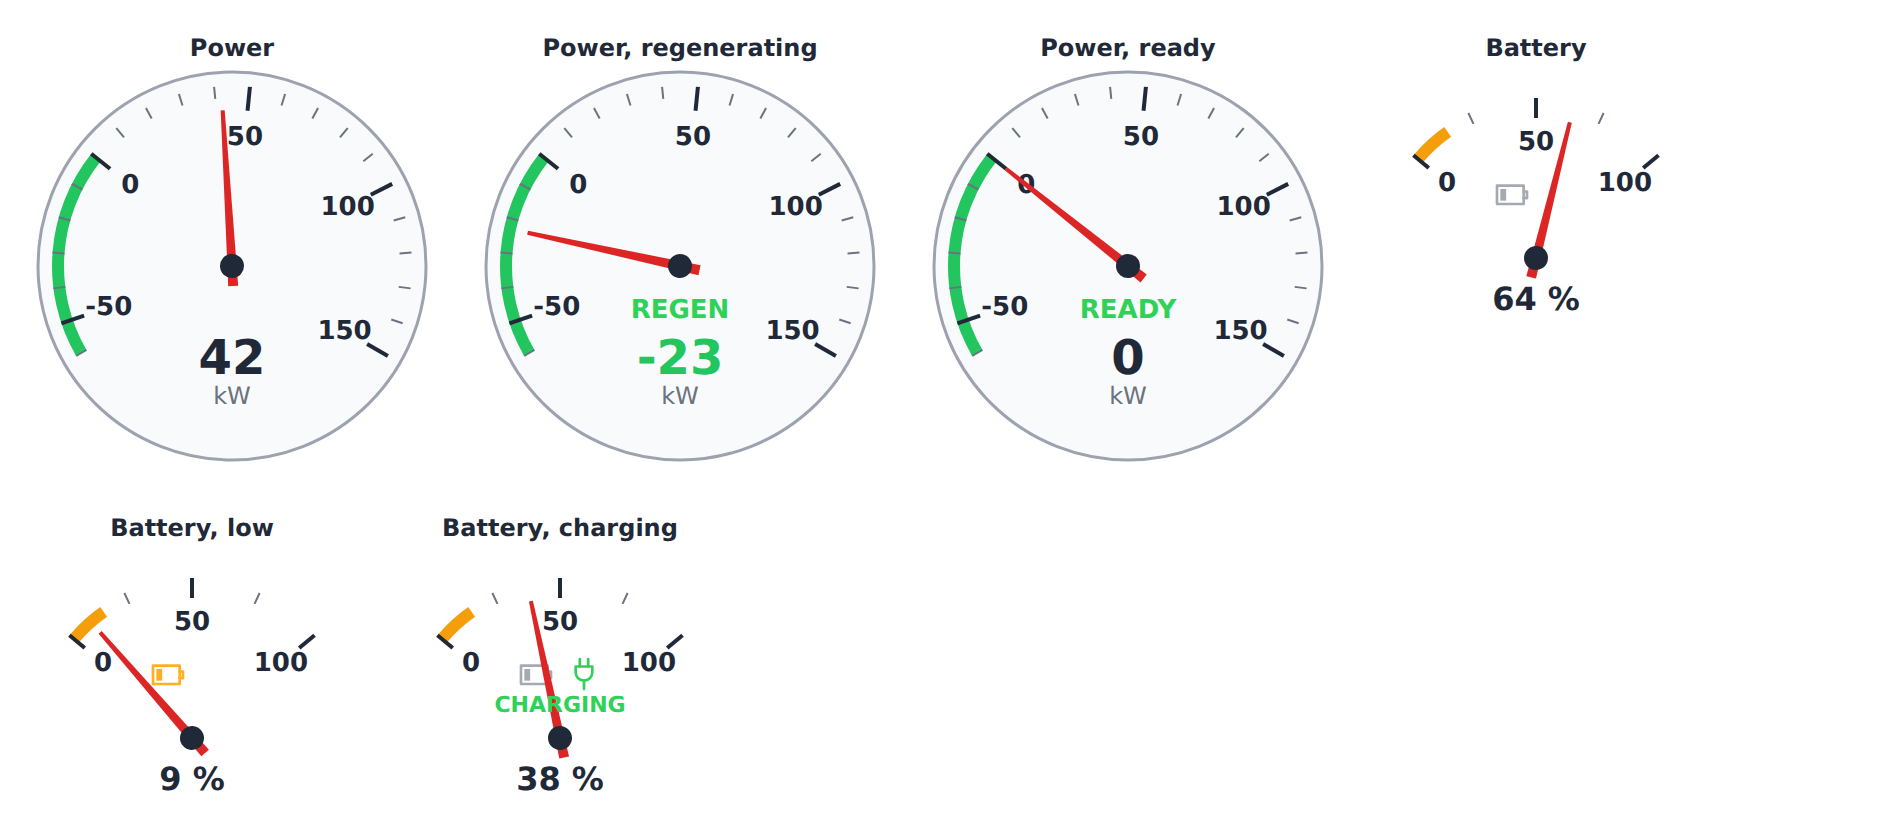
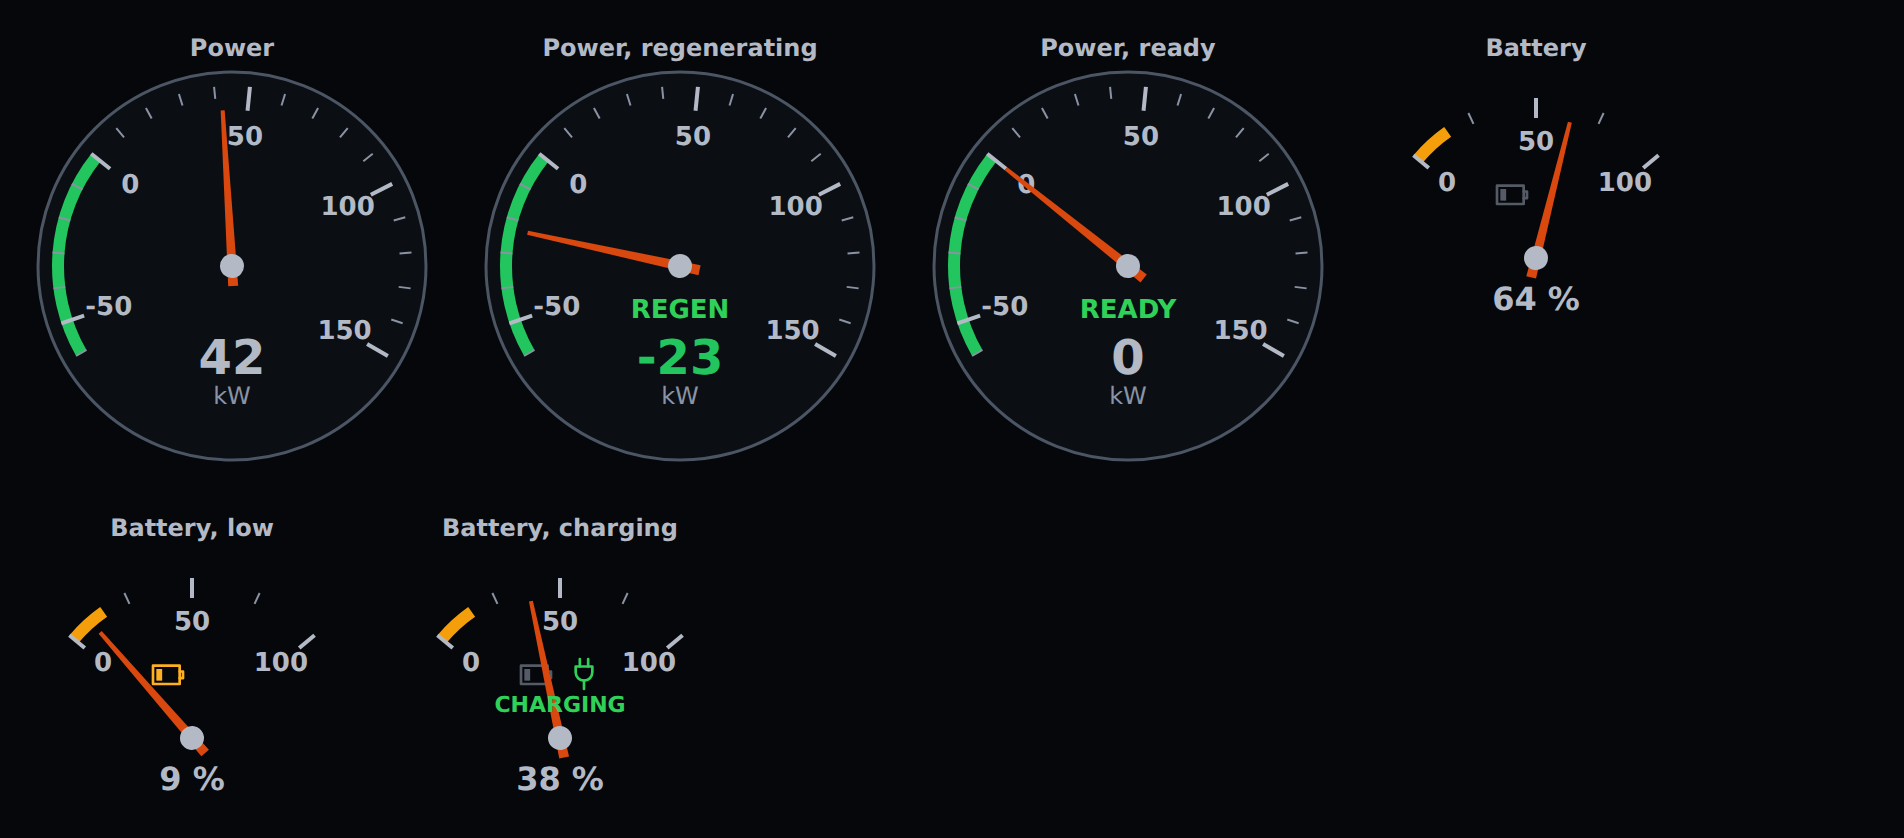
A power meter reading below zero while regenerating, a battery gauge that lights its symbol when low and says when it charges, the power flow of a hybrid drivetrain — engine, battery, wheels — and the energy consumption of the trip computer.
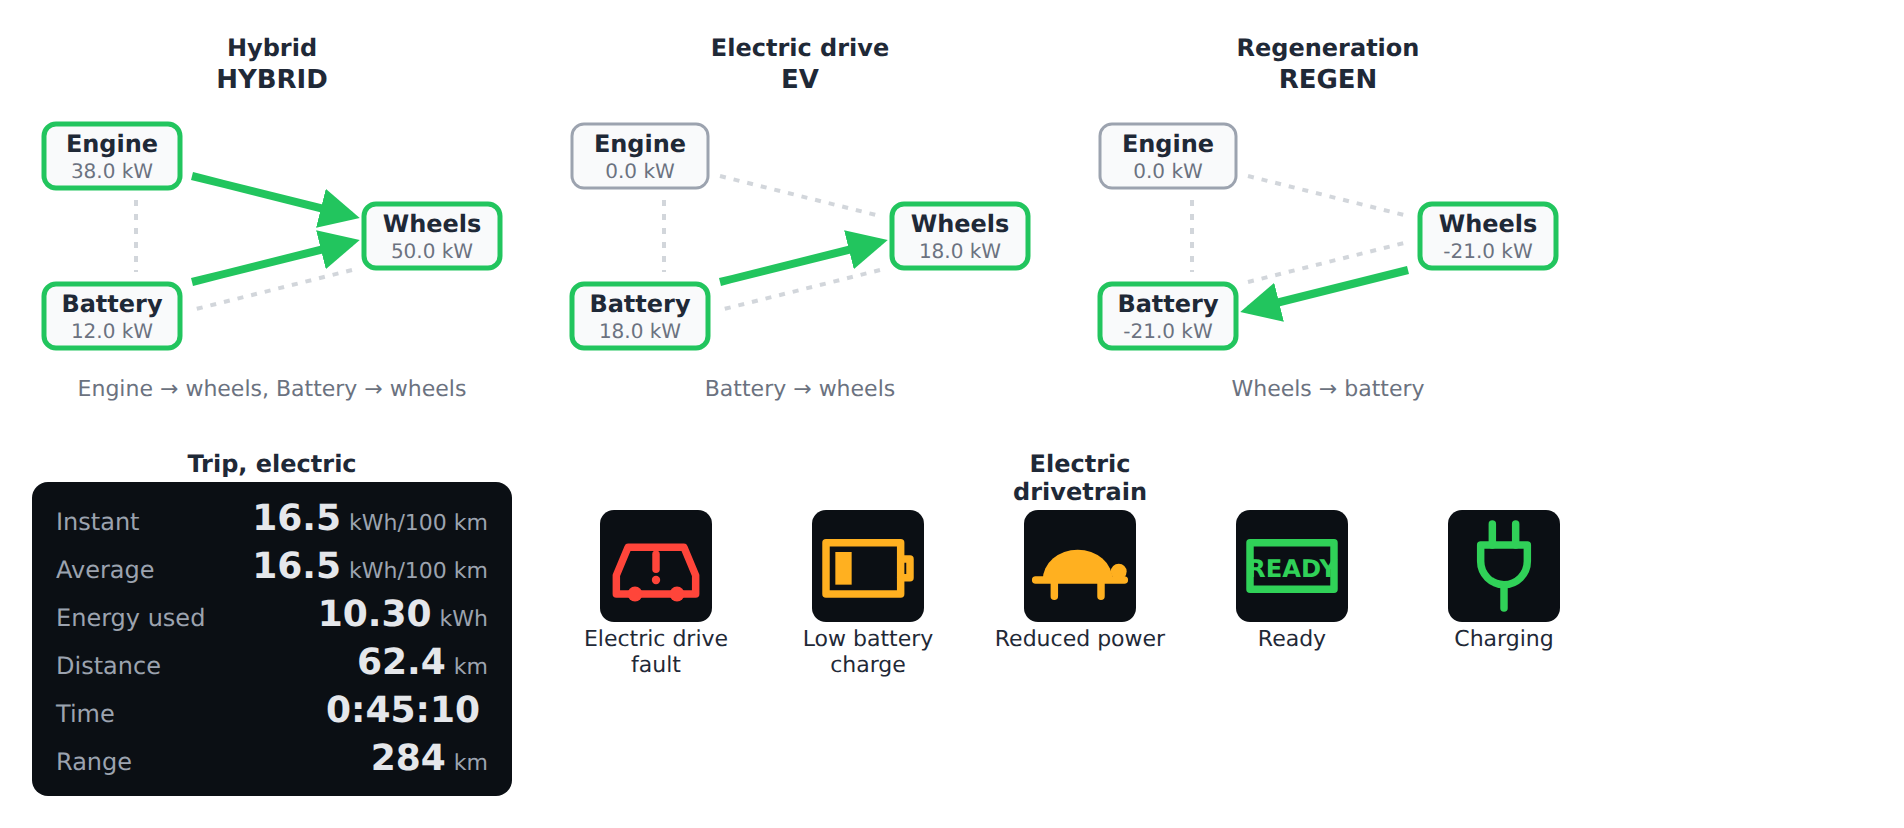
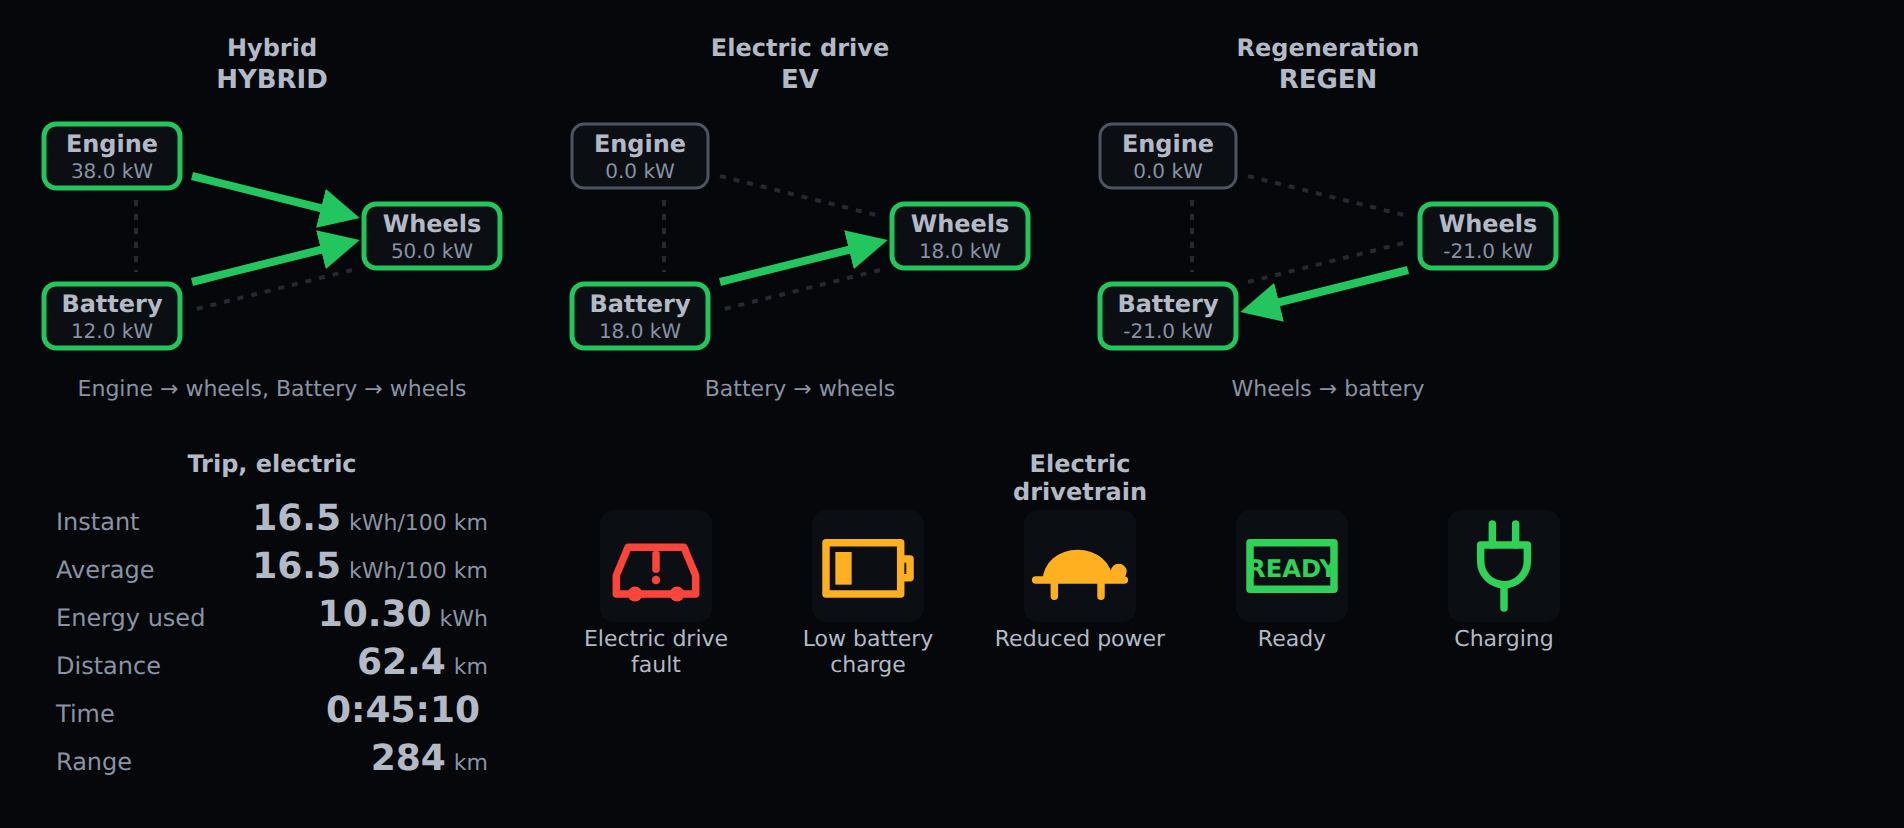
Dials
The speedometer, tachometer, fuel and temperature gauges, with a speed limit, a shift light, a hybrid's ready state, a unit system and the day and night themes.
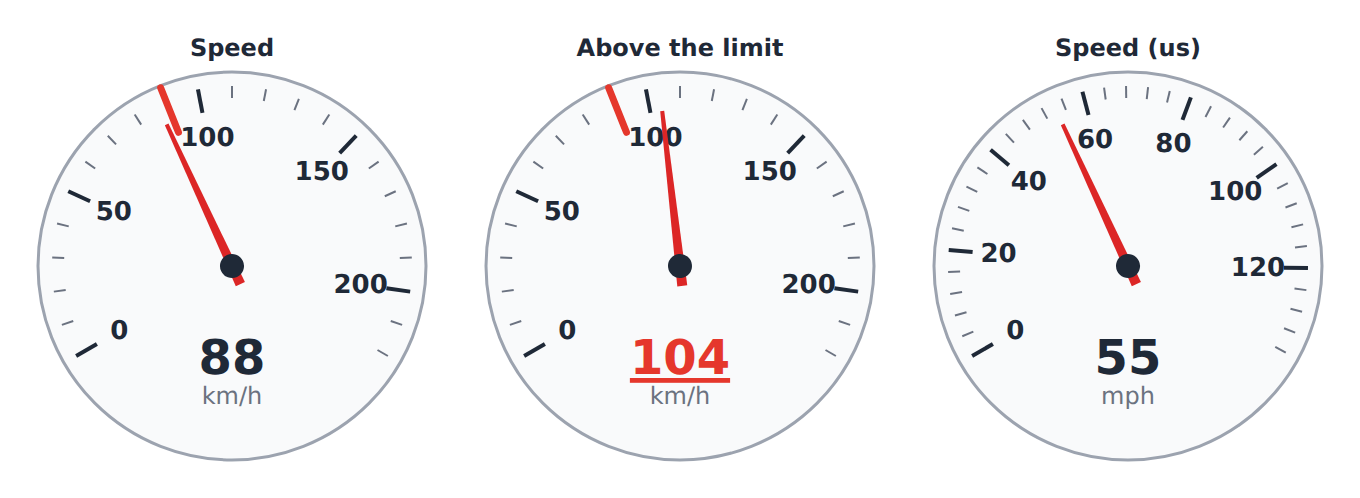
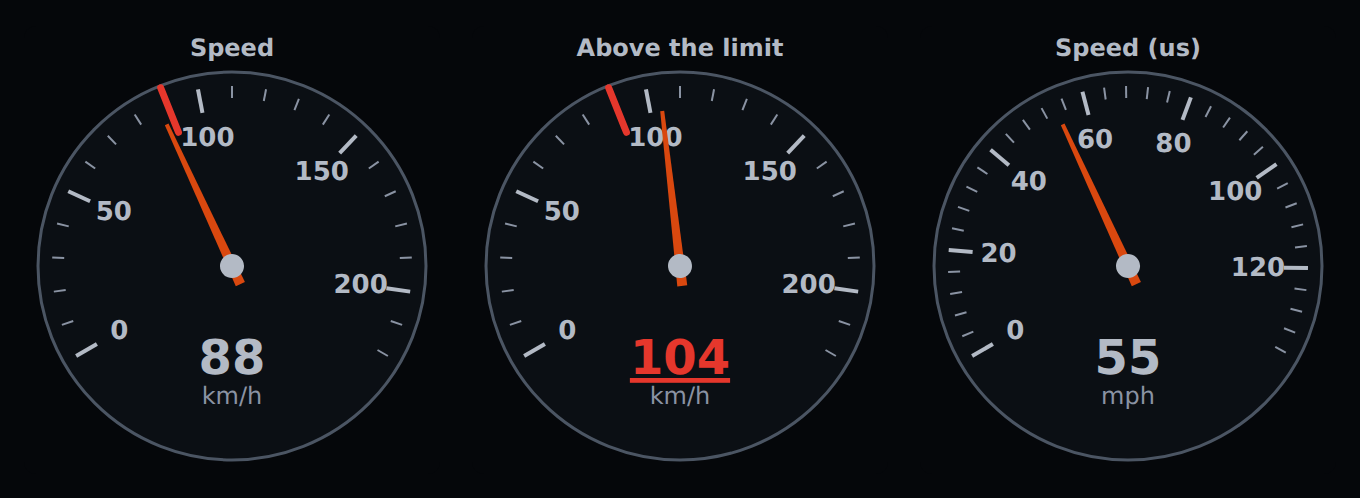
Digital displays
The trip computer, from the raw figures of a trip, the odometer and the gear indicator.
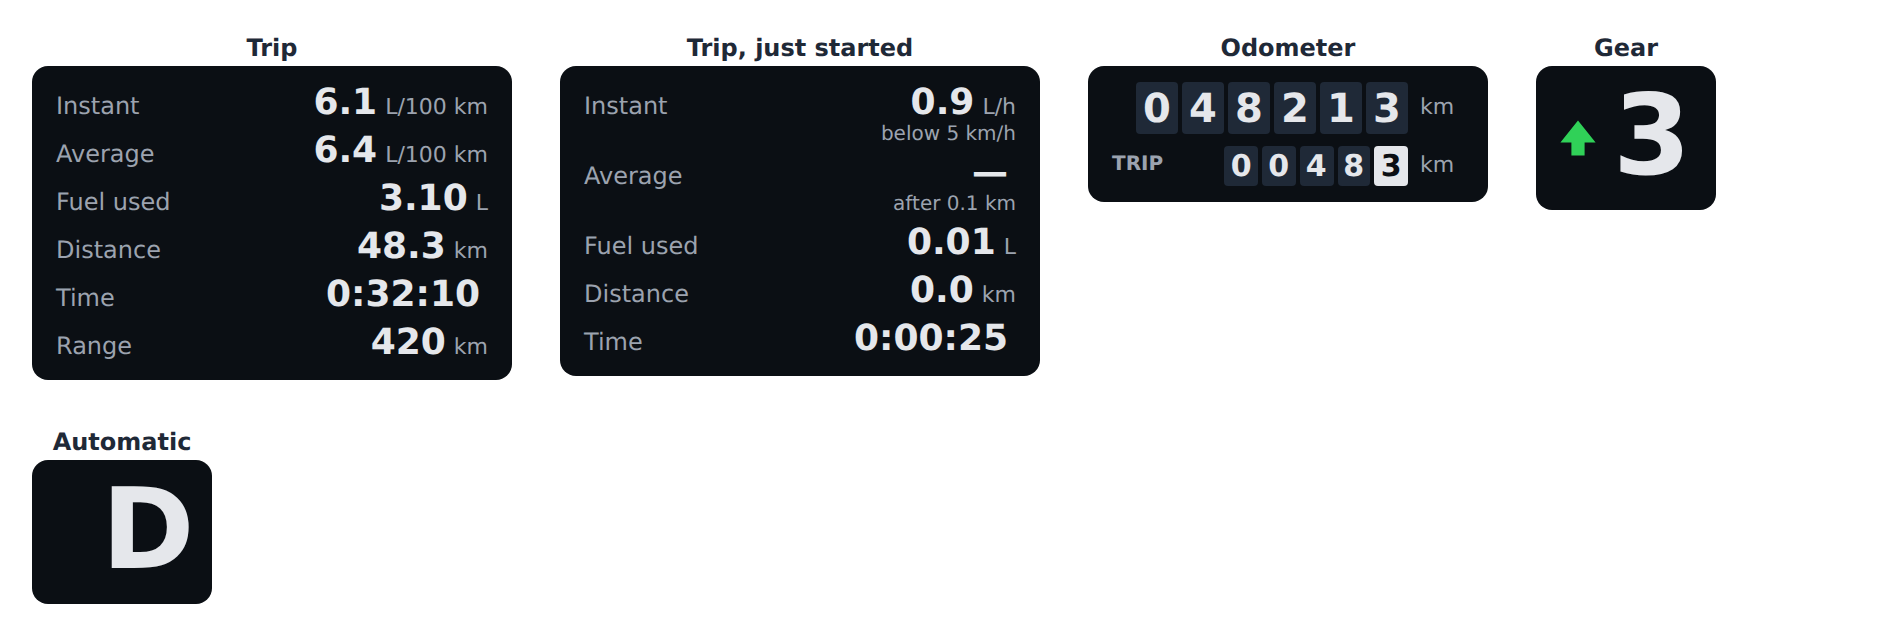
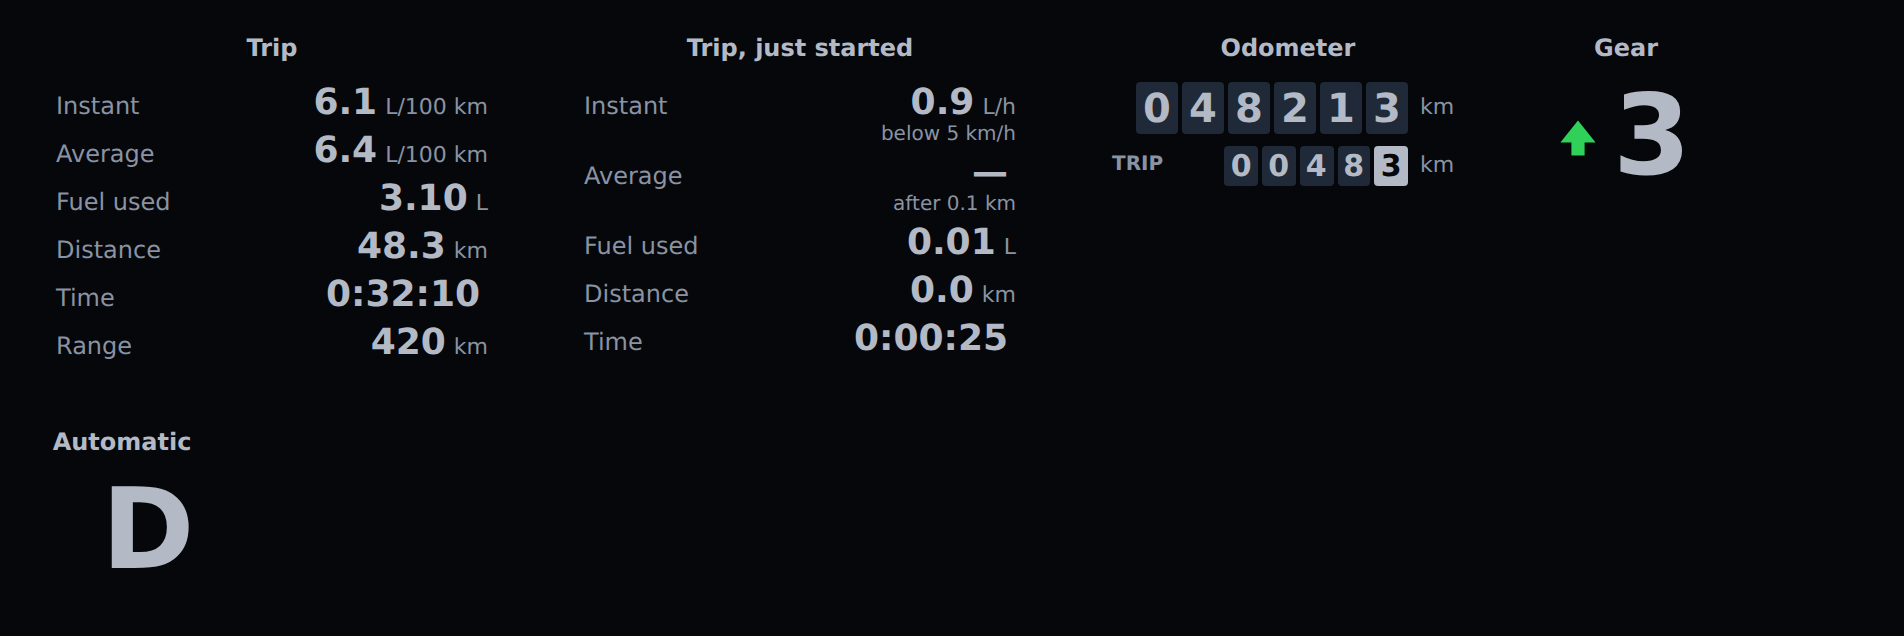
Tell-tales
Every tell-tale, lit or blinking at will.
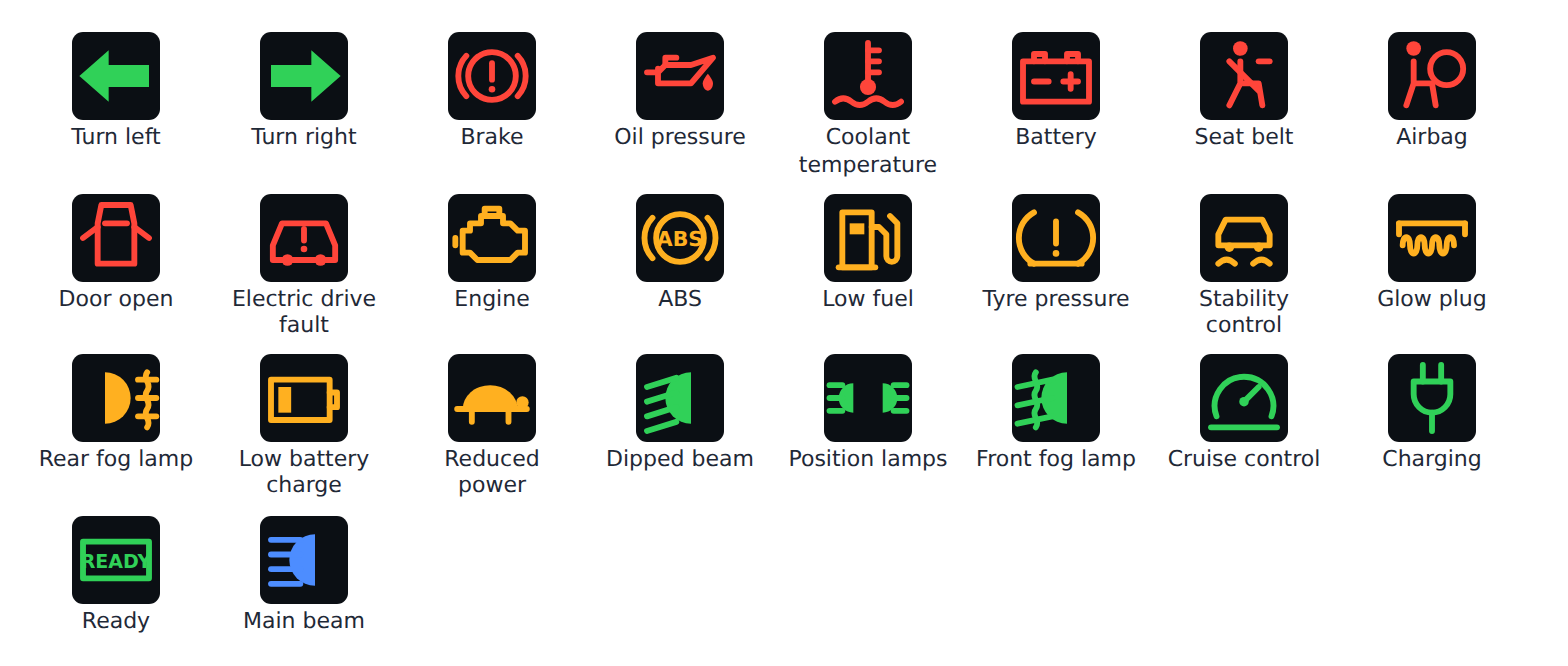
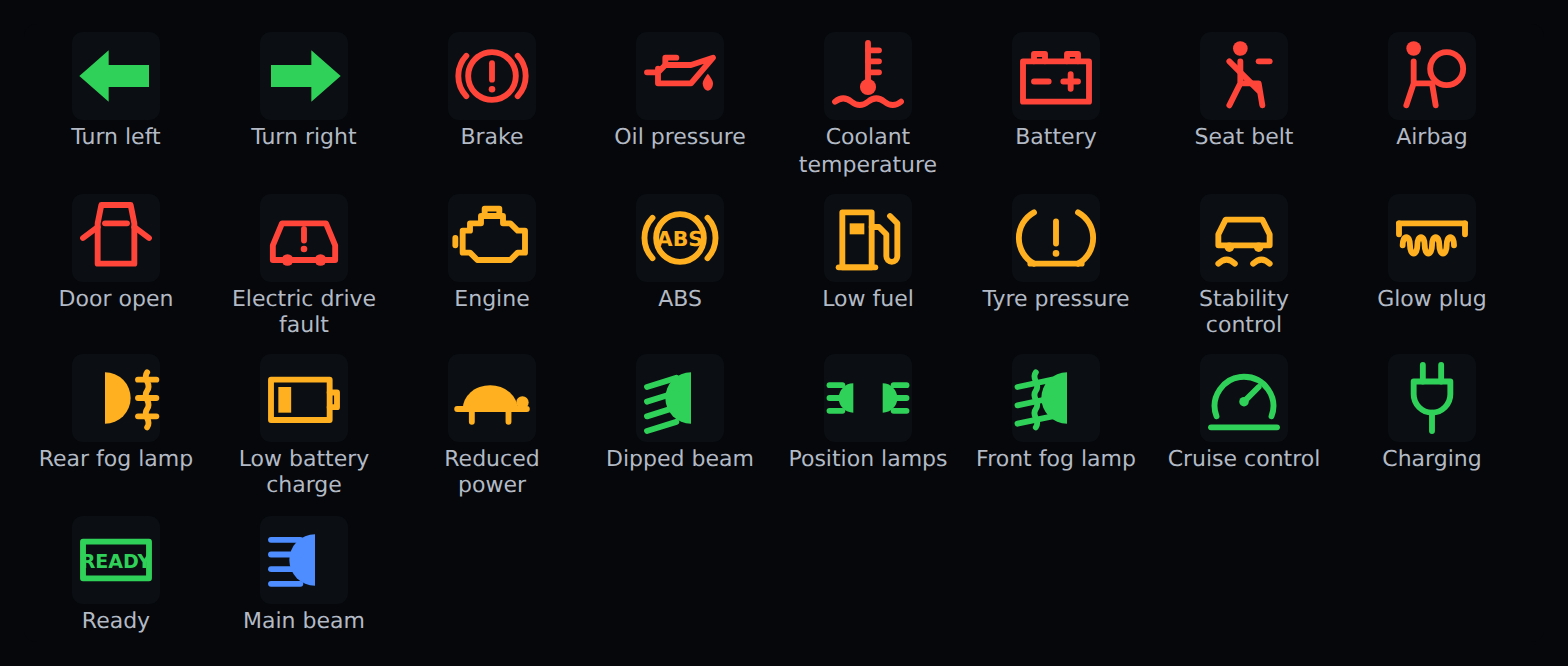
Locally
With the marimo editor, from a clone of the repository (see Development):
pip install marimo "anywidget-instruments @ git+https://github.com/AnywidgetInstruments/anywidget-instruments-industrial"
npm install && npm run build && pip install -e .
marimo edit lite/marimo/electric.py
Tell-tales in JupyterLite
A notebook lighting the tell-tales from Python, in the browser, with no installation.
In Grafana
afm-host-panel, a Grafana panel
plugin that hosts anywidget front-end modules, shows the earlier cluster preview, drawn with anywidget-instruments widgets, on a
dashboard: the dials follow Grafana queries and the tell-tale a dashboard variable. The
panels are named after the widgets of this library (anywidget_instruments_automotive:Speedometer,
...), so that a dashboard keeps working when the panel hosts them.
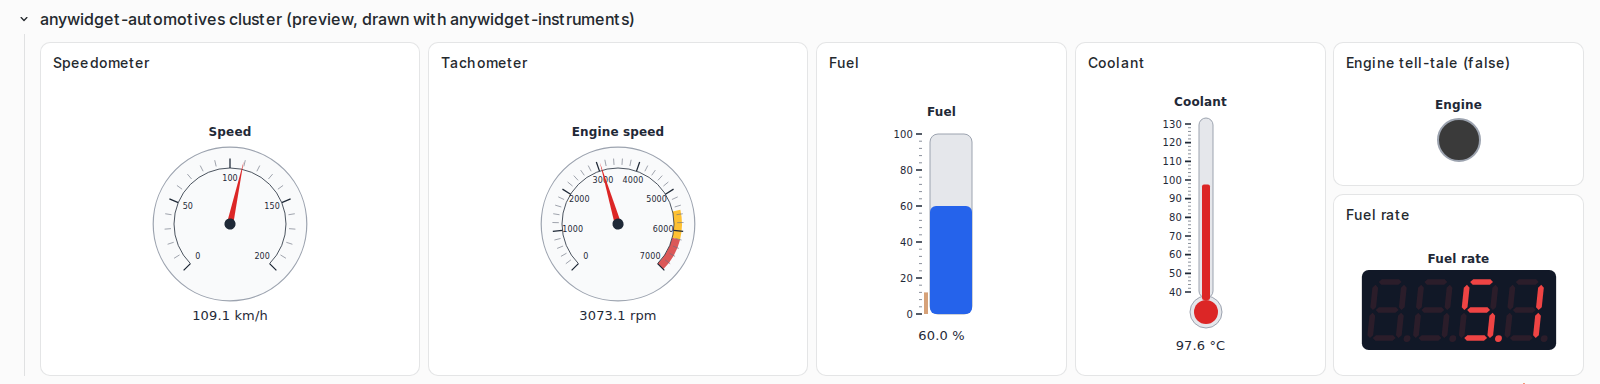
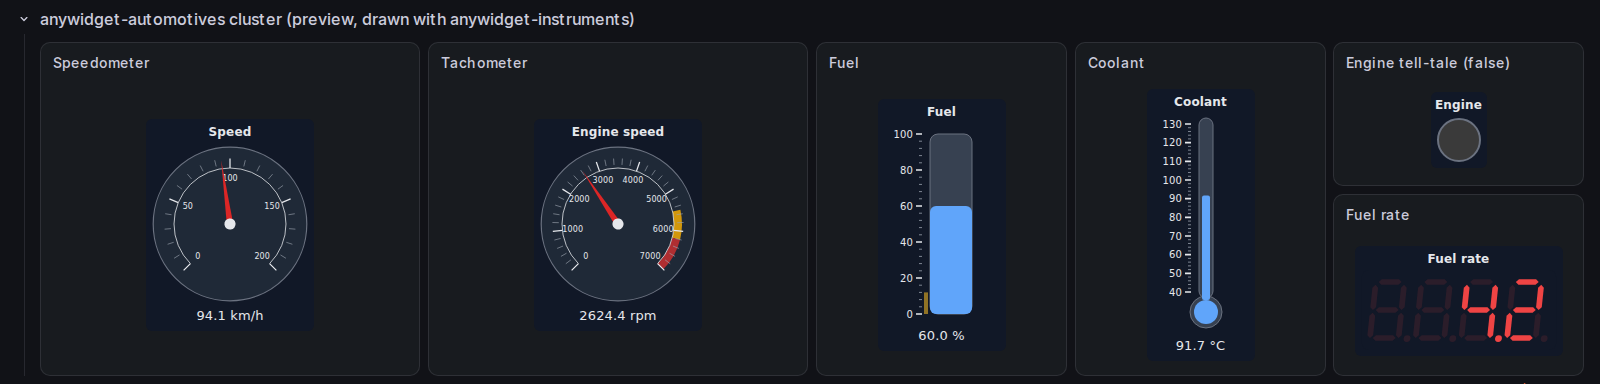
The cluster preview on the demonstration dashboard of afm-host-panel, fed by simulated data.
See the safety notice: these are not vehicle instruments.